Blog · Methodology, Backtest, Game model
Priced blind
We had the model price two seasons of games it was never fitted on. It has some read on who wins, it overstates that read, and it has no read at all on totals.
By Chase ·
Any picks site can find a hot month to screenshot. We wanted to know whether our model was any good, so we had it price two seasons of games it was never fitted on and kept score. Parts of it held up, and the parts that didn't changed what we put on the board.
How the test works
For every game day from October 2024 to this week, the model got only what it would have known that morning: a year of team results, a year of goalie results, days of rest, and its own guess at who would start in goal. It priced every game on the slate. Then the day's results went into its history and it moved on to the next day. That came to 2,713 regular-season games, priced by the same code that prices tonight's.
We scored each probability with log loss, which punishes confident misses hard, against the laziest opponent we could think of, a forecast that says the same thing every night. For the moneyline that rival says the home team wins 54.3% of the time, every game. Beating it is the minimum for a model to be worth reading. It tells you nothing about beating a sportsbook, a much tougher opponent, which comes up again at the end.
What it gets right
On the moneyline the model beats the constant by 0.0128 in log loss, give or take 0.0037. That is about three and a half standard errors, so we're fairly confident the model has learned something about teams. Put another way, the side it favoured won 56.6% of the time, against 54.3% for taking the home team every night. Both puck lines also clear the bar, at roughly two and a half to three standard errors each.
Those are small numbers, which is normal for hockey, a low-scoring sport where any given night is close to a coin flip. A hit rate also means little without the prices attached: betting heavy favourites gets you to 65% and still loses money. That is why the record page grades units and closing prices, not wins.
Where it oversells
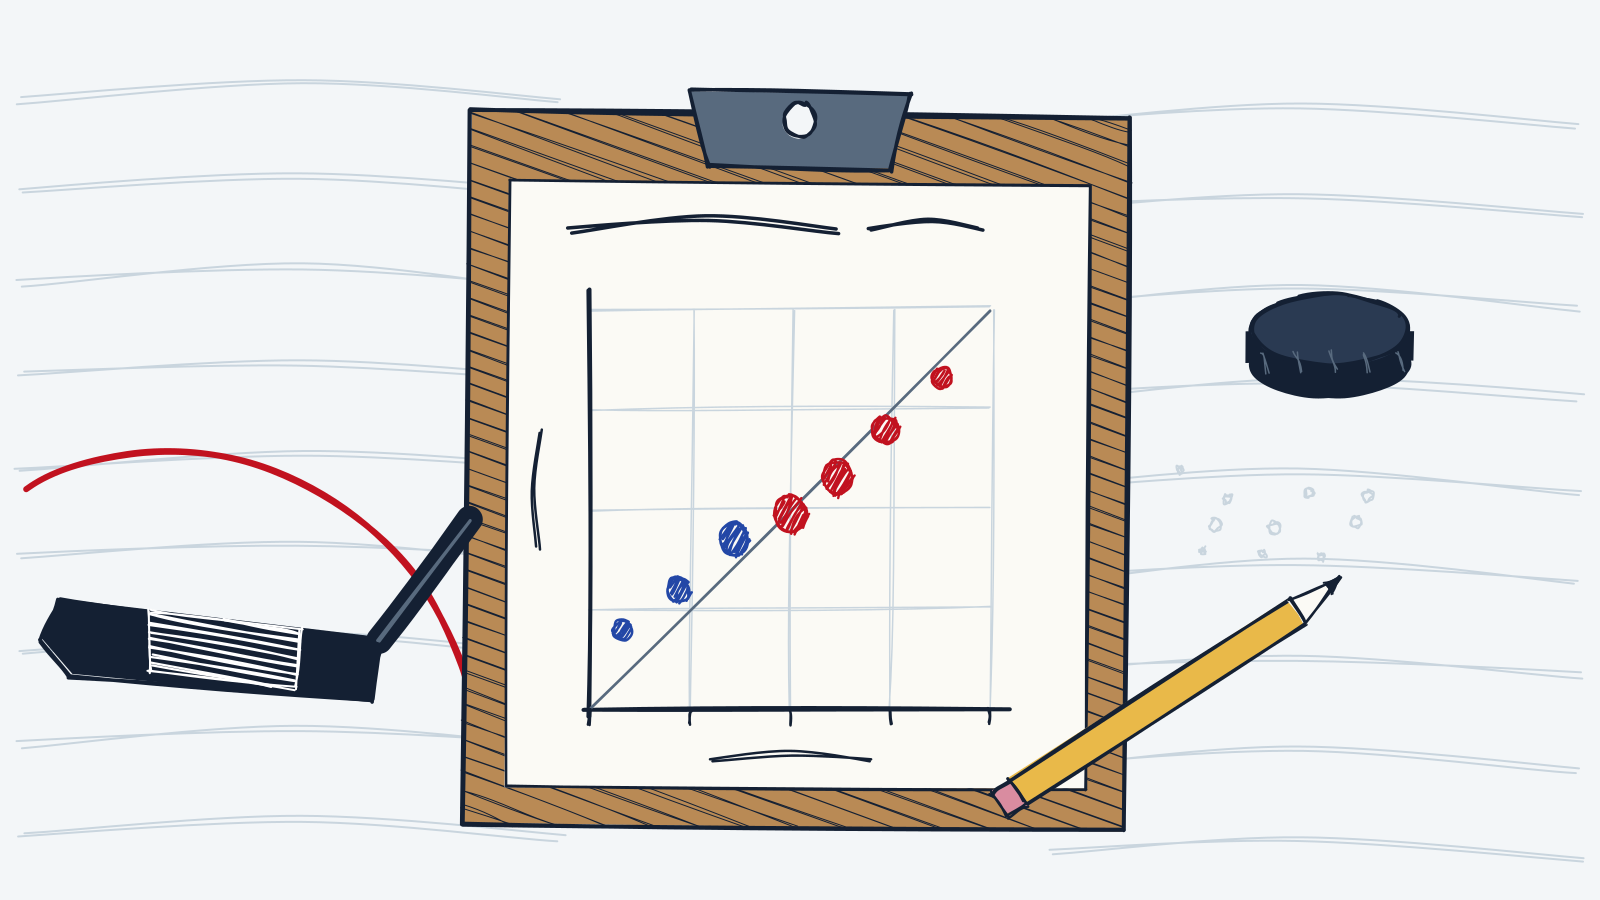
The model leans the right way and leans too far. When it made a team a 60 to 65% favourite, that team won 58.4% of the time. Fit a line through the chart below and the slope is about 0.84, where 1.0 would mean the probabilities mean what they say. Roughly, every probability it states is about a sixth too far from a coin flip.
When the model favoured a side
Games grouped by how strongly the model favoured one side; dot size is the number of games. On the diagonal, a 60% favourite wins 60% of the time.
↑ It happened
We could shrink the model's numbers by that amount and call it fixed, but we would be fitting the correction on the same games we are reporting, which flatters it. What we do instead is blend the model with the betting market before measuring any edge, and give the model only a quarter of the say. That is a much heavier discount than 0.84 asks for, on purpose. The market knows things our model doesn't, like injuries, what happened at the morning skate and who is in goal, so we post smaller edges and expect fewer of them to blow up.
What it gets wrong
Totals are the weak spot. Over 5.5 goals and over 6.5 goals both come out slightly worse than the constant, and so does guessing which games go to overtime. The gaps are well inside the noise, so the fair reading is that the model shows no skill on these markets. Whether it does active harm there is a separate question, and two seasons can't settle it.
How far the model beat a constant guess
Gain in log loss, in thousandths, plus or minus one standard error; 2,713 games. Above zero, the model knows something. The bottom three are indistinguishable from zero.
- Moneyline+12.8 ± 3.7
- Puck line, home −1.5+9.7 ± 3.3
- Puck line, road −1.5+8.0 ± 3.2
- Goes to overtime−0.2 ± 0.6
- Total over 6.5−1.5 ± 2.4
- Total over 5.5−1.9 ± 2.2
Ratings built on scoring chances tell you which team tends to control a game, and control decides most of who wins. Whether a night ends 3–2 or 5–3 turns on hot goaltending and finishing, and nothing we measure before puck drop predicts either well.
The trouble was what we did with that. On the first night of live odds the board showed totals edges of 10 points, which were noise dressed up as value. So the model no longer gets a vote on totals. Our price there is the market's price, a totals edge can only mean one book is out of line with the others, and totals cannot be the free pick. We rerun the test every week, and if totals start passing the model gets its say back.
Things we tried that did not work
The raw back-to-back numbers look like a gift. In the test games, home teams won 62.2% of the time when only the road team was on the second night of a back-to-back, and 49.0% when only the home team was. Part of the story is the goalie: teams start the previous night's goalie again less than one time in ten, and our starter guess did not know that. It now skips him, and on those nights it went from right 30% of the time to right 73%. Then we measured what that was worth, and it was almost nothing, because our goalie ratings are pulled hard toward average. One season of save percentage is mostly noise, so swapping one goalie for another barely moves a projection.
The rest should be fatigue, so we gave the model a single fatigue setting, fitted it on 2024-25 and tested it on 2025-26. It improved the season it was fitted on and made the next one slightly worse, on 378 games. That does not prove fatigue is zero. It means this version didn't survive new data, so it stays off until one does. We're including it because leaving out the failures would make the rest of this less believable.
We also found a bug of our own making. The rush flag, which labels a shot as coming off the rush, was counting shots straight off neutral-zone faceoffs, because the faceoff dots sit just inside the neutral zone. Its rush shots scored at about three-fifths of the league rate. Fixed, rushes are 7% of shots and score a little more often than set plays, as they should. The fix didn't make the expected-goals model any sharper, but the shot-type splits on team pages are right now.
Shots on goal
The props model got the same treatment, scored only on 2025-26 games, and it is the strongest thing we price: for three or more shots it beats the constant by a wide margin, log loss 0.453 against 0.523. It runs about 2% high on average. The code carried a note promising to switch from a Poisson distribution to a negative binomial once the data showed shot counts were more spread out than Poisson allows. They are, slightly, and the switch helped at two lines and hurt at one by amounts too small to matter. Poisson stays.
What this does not tell you
None of this shows we can beat a sportsbook. Books price with information we do not have, and we only have their odds from 13 October 2026 on, so there is no history to test against. So that test runs live instead. Each edge we post is timestamped before puck drop, then graded on the result and on closing line value, which shows skill within weeks where wins and losses take seasons.
The numbers here update every Monday on the report card. If they get worse, the report card will show it.