GRIT & GF
Michael Rasmussen

Detroit Red Wings, Centre

Michael Rasmussen

  • Shot-eater
  • Physical
Points, 2026–27
2
0 G, 2 A in 8 GP
Individual xG
0.7
0 goals from it
Ice time per game
17:03
9 shots on goal
xGF% at 5v5
49.5
share of chances while he's on

Michael Rasmussen has 0 goals and 2 assists (2 points) in 8 games for the Detroit Red Wings in 2026–27, with 9 shots on goal and 17:03 of ice time a game. His Grit & GF rating for 2026–27 is 96.4 out of 100, provisional until he has 15 to 20 games.

8 games in. The methodology requires 15 to 20 games to be accurate, so this season's rating still leans on the league average for his position and will move.

GRIT & GF

96.4050100
Rated above 95% of forwards
Goals above average
−0.3
Wins
−0.05
Physicality98thGF16thIntimidation50thChemistry46thClutch78th

Where the rating comes from

Weight × score in standard deviations. They sum to +1.05, which the normal curve turns into the rating.

Your weights

Under these weights he ranks above 94.5% of 402 rated players

The default weights are our call. Set your own; they get rescaled to add up to 100%.

Physicality

+2.26 SD · 98th percentile · weight 38% · +0.1 goals

What he does with his body: hits, blocks and takeaways (scaled toward per-game totals by his ice time), penalties drawn, and penalties taken against him.

  • Hitsper 60All situations, pulled toward average when the sample is small.6.077th pct
  • Blocked shotsper 60All situations.3.998th pct
  • Takeawaysper 60As recorded by the arena scorer, which varies by building.1.1280th pct
  • Penalties drawnper 60How often he gets under someone's skin enough to put his team on the power play.0.8655th pct
  • Penalties takenper 60Counts against him, at half the weight of penalties drawn.0.5866th pct
  • Ice time× position averagePer-game ice time against his position's average. Physical rates are scaled by this to the power 0.75.0.9670th pct

Percentiles are against 402 rated forwards in 2026-27, on 101 minutes of his 5-on-5 time. Hits, blocks and takeaways count toward the rating and are worth zero goals until a study shows otherwise. Model grit-0.5.
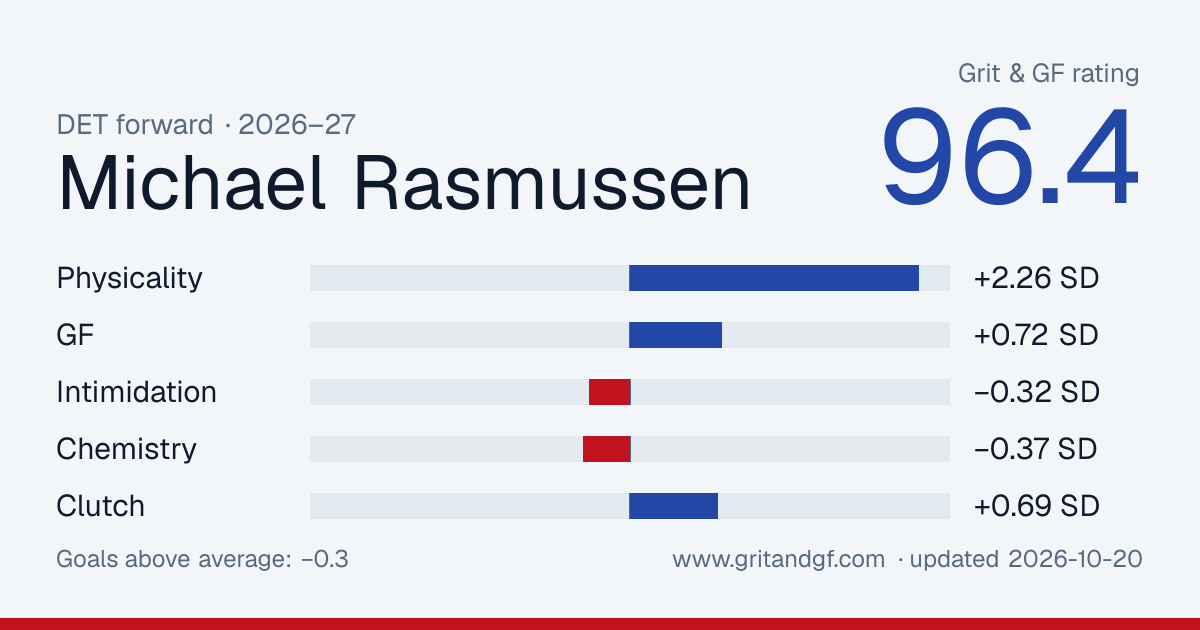
Embed or share this card

Free to use with a link back. The image updates as his rating does.

Michael Rasmussen's Grit & GF card
Download PNG

Game notes

Written the morning after from the night's stats, for games where he did something worth a sentence.

  1. vs OTT

    Tuesday, October 6

    Physical

    Michael Rasmussen finished 7 checks. He has 0 points in 3 games this season. He played 20:05 and had no shots on goal. The Red Wings beat the Senators 5-3.

Player card

Percentile among 378 forwards with enough games this season. 50 is the median.

Scoring

  • Ice time per game17:03
    69
  • Points per 600.88
    16
  • Goals per 600.00
    11
  • Individual xG per 600.31
    4
  • Shots per 604.0
    14

5-on-5 play

  • xG for per 60, on ice2.18
    33
  • xG against per 60, on ice2.22
    67
  • xGF%49.5%
    47

Physical

  • Hits per 607.9
    76
  • Blocks per 605.7
    96
  • Penalty minutes per 600.9
    67

Skating and shooting

NHL EDGE puck and player tracking, 2026–27. Percentiles are the league's, against all skaters.

Skating

  • Top speed21.5 mph
    42
  • Bursts over 20 mph12
    59
  • Distance skated19 mi
    52

Shooting

  • Hardest shot81.1 mph
    57
  • Shots on goal9
    43
  • Shooting %0.0%
    13

Zone time

  • Offensive zone time40.2%
    32
  • Offensive zone time, even strength41.2%
    54

Who he plays with

His most-used linemates at 5-on-5 this season, with what happened while they were out together.

LinematesGamesTOIShot attemptsxGGoalsxG share
Andrew Copp, Keegan Kolesar841:0228–510.9–2.00–230%
Andrew Copp, Nate Danielson213:2710–140.7–0.61–053%
Keegan Kolesar, Marco Kasper17:1211–20.4–0.00–098%
Andrew Copp, Lucas Raymond77:084–40.2–0.10–063%
J.T. Compher, Keegan Kolesar26:518–30.2–0.10–058%
Andrew Copp, Sheldon Dries25:343–70.0–0.30–02%

Where he shoots from

His unblocked shots this season, attacking right. 0 goals from 15 attempts.

GoalShot or miss

Last 20 games

Columns are his individual expected goals, the quality of his own chances. Dots are goals he scored.

ixGGoal
0.000.100.200.30
02-0410-17

By season

SeasonGPGAPSOGixGTOI/GPHitsBlkxGF% 5v5
2026–27802290.717:03181349.5
2025–26646814659.312:39647344.3
2024–257711102110014.613:251417546.8
2023–247513203310113.415:121248945.2

Last 20 games

DateTOIGASOGixGHitsBlkPIM
2026-10-1718:340110.05240
2026-10-1515:420110.05110
2026-10-1317:330010.01110
2026-10-1018:060000.00030
2026-10-0915:190020.05300
2026-10-0620:050000.22720
2026-10-0416:090040.25310
2026-10-0214:540000.09112
2026-04-077:570000.00140
2026-04-0512:080000.00110
2026-04-049:310010.03020
2026-03-1212:580010.00220
2026-03-1016:260010.14120
2026-03-0810:570010.11010
2026-03-067:430000.00200
2026-03-0416:380000.00220
2026-03-0217:290020.19020
2026-02-2812:170010.12230
2026-02-2610:480000.00020
2026-02-0410:440000.00000