GRIT & GF
Pierre-Olivier Joseph

Vancouver Canucks, Defence

Pierre-Olivier Joseph

  • Steady
  • Depth
Points, 2025–26
6
1 G, 5 A in 31 GP
Individual xG
1.1
1 goals from it
Ice time per game
13:18
22 shots on goal
xGF% at 5v5
48.4
share of chances while he's on

Pierre-Olivier Joseph has 1 goal and 5 assists (6 points) in 31 games for the Vancouver Canucks in 2025–26, with 22 shots on goal and 13:18 of ice time a game. His Grit & GF rating for 2025–26 is 14.0 out of 100.

GRIT & GF

2025-26

14.0050100
Rated above 38% of defencemen
Goals above average
+2.0
Wins
+0.33
Physicality16thGF32thIntimidation96thChemistry78thClutch80th

Where the rating comes from

Weight × score in standard deviations. They sum to −0.63, which the normal curve turns into the rating.

Your weights

Under these weights he ranks above 38.1% of 281 rated players

The default weights are our call. Set your own; they get rescaled to add up to 100%.

Intimidation

+1.62 SD · 96th percentile · weight 11% · +1.6 goals

How the other team plays when he is on the ice, compared with when he is off it in the same games, at 5-on-5.

  • Chances suppressedxGA per 60, off minus onPositive means opponents create less with him on the ice.0.2495th pct
  • Opponents' hits suppressedper 60, off minus onPositive means opponents finish fewer checks with him out there.0.3861th pct

Percentiles are against 281 rated defencemen in 2025-26, on 391 minutes of his 5-on-5 time. Hits, blocks and takeaways count toward the rating and are worth zero goals until a study shows otherwise. Model grit-0.5.
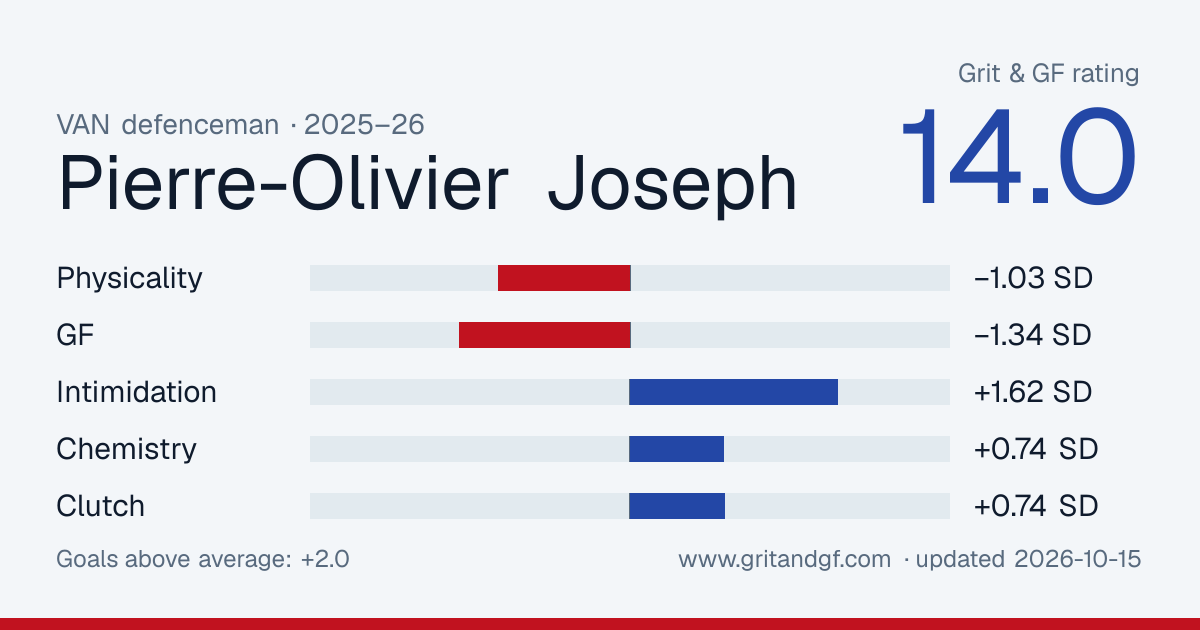
Embed or share this card

Free to use with a link back. The image updates as his rating does.

Pierre-Olivier Joseph's Grit & GF card
Download PNG

Game notes

Written the morning after from the night's stats, for games where he did something worth a sentence.

  1. at VGK

    Wednesday, February 4

    Drought over

    Pierre-Olivier Joseph scored for the first time in 73 games. That was his first goal of the season. The Canucks lost 5-2 to the Golden Knights.

Player card

Percentile among 239 defencemen with enough games this season. 50 is the median.

Scoring

  • Ice time per game13:18
    5
  • Points per 600.87
    51
  • Goals per 600.15
    40
  • Individual xG per 600.17
    38
  • Shots per 603.2
    37

5-on-5 play

  • xG for per 60, on ice2.44
    42
  • xG against per 60, on ice2.60
    41
  • xGF%48.4%
    40

Physical

  • Hits per 602.6
    50
  • Blocks per 604.1
    49
  • Penalty minutes per 601.2
    64

Who he plays with

His most-used defence partners at 5-on-5 this season, with what happened while they were out together.

PartnerGamesTOIShot attemptsxGGoalsxG share
Tyler Myers21147:43143–1425.2–6.63–1244%
Zeev Buium1549:0141–452.2–1.81–455%
Elias Pettersson1546:3328–451.0–1.70–238%
Tom Willander2443:1636–451.8–2.01–147%
Victor Mancini534:5944–371.8–1.83–350%
Filip Hronek3032:4639–292.0–1.74–255%
Marcus Pettersson2329:0928–271.5–1.20–157%
Quinn Hughes53:153–60.1–0.10–241%

Where he shoots from

His unblocked shots this season, attacking right. 1 goals from 33 attempts.

GoalShot or miss

Last 20 games

Columns are his individual expected goals, the quality of his own chances. Dots are goals he scored.

ixGGoal
0.000.100.20
12-3004-09

By season

SeasonGPGAPSOGixGTOI/GPHitsBlkxGF% 5v5
2025–2631156221.113:18182848.4
2024–2547033421.715:16363648.6
2023–24522911421.515:06474447.0

Last 20 games

DateTOIGASOGixGHitsBlkPIM
2026-04-0915:040010.07040
2026-04-0413:000100.00312
2026-04-0210:520010.02212
2026-04-0111:010000.03000
2026-03-2815:020000.04210
2026-03-2615:210020.18110
2026-03-2412:480000.00210
2026-03-0210:380000.00000
2026-02-2813:260110.14002
2026-02-2513:530000.00000
2026-02-0415:061020.09000
2026-02-0216:180000.03200
2026-01-3117:220120.04020
2026-01-2913:010020.04010
2026-01-2515:050000.00000
2026-01-1313:310010.06030
2026-01-1217:150100.00110
2026-01-0615:340000.03020
2026-01-0213:520000.02000
2025-12-3014:090000.00120