GRIT & GF
Eric Robinson

Carolina Hurricanes, Left wing

Eric Robinson

  • Physical
  • Playmaker
Points, 2026–27
6
2 G, 4 A in 10 GP
Individual xG
1.6
2 goals from it
Ice time per game
12:27
16 shots on goal
xGF% at 5v5
54.0
share of chances while he's on

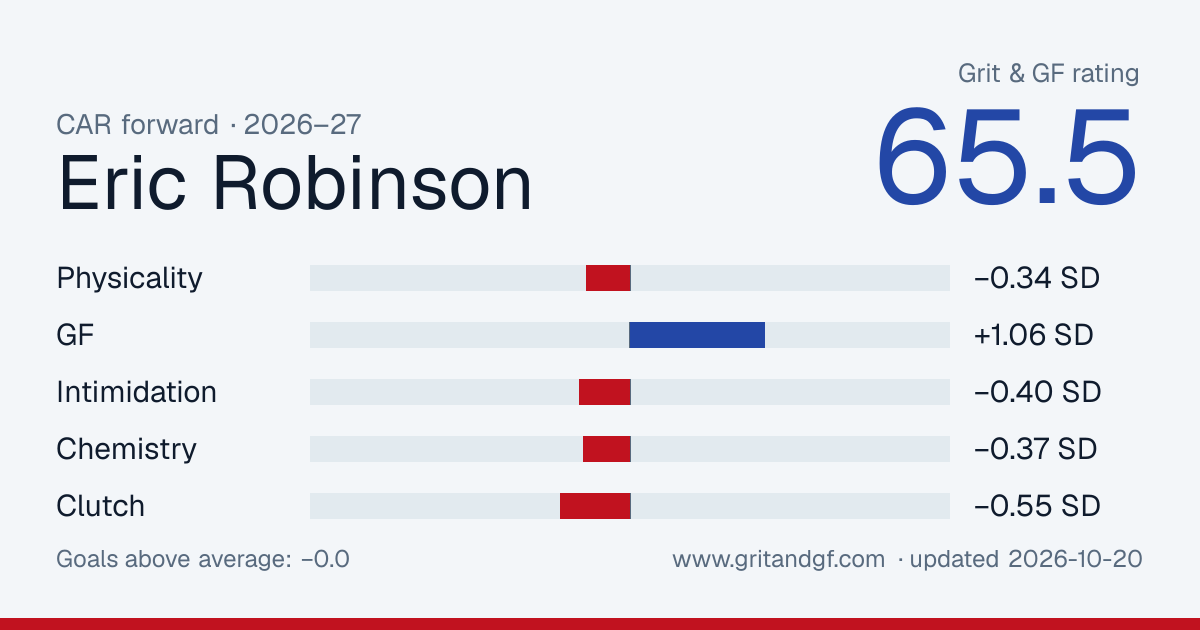
Eric Robinson has 2 goals and 4 assists (6 points) in 10 games for the Carolina Hurricanes in 2026–27, with 16 shots on goal and 12:27 of ice time a game. His Grit & GF rating for 2026–27 is 65.5 out of 100, provisional until he has 15 to 20 games.

10 games in. The methodology requires 15 to 20 games to be accurate, so this season's rating still leans on the league average for his position and will move.

GRIT & GF

65.5050100
Rated above 51% of forwards
Goals above average
−0.0
Wins
−0.00
Physicality51thGF66thIntimidation46thChemistry46thClutch24th

Where the rating comes from

Weight × score in standard deviations. They sum to +0.18, which the normal curve turns into the rating.

Your weights

Under these weights he ranks above 51.2% of 402 rated players

The default weights are our call. Set your own; they get rescaled to add up to 100%.

GF

+1.06 SD · 66th percentile · weight 38% · −0.2 goals

Goals from the hard areas: attempts from inside 20 feet, rebounds and tips, and his own expected goals, all situations.

  • Inner-slot attemptsper 60Unblocked attempts from inside 20 feet.4.4668th pct
  • Rebounds and tipsper 60Second chances and redirects: the goals you get by standing where it hurts.3.2775th pct
  • Individual expected goalsper 60The quality of his own chances, all situations.0.9744th pct

Percentiles are against 402 rated forwards in 2026-27, on 105 minutes of his 5-on-5 time. Hits, blocks and takeaways count toward the rating and are worth zero goals until a study shows otherwise. Model grit-0.5.
Embed or share this card

Free to use with a link back. The image updates as his rating does.

Eric Robinson's Grit & GF card
Download PNG

Game notes

Written the morning after from the night's stats, for games where he did something worth a sentence.

  1. vs MTL

    Thursday, May 21

    Drought over

    Eric Robinson scored for the first time in 20 games. He has 13 goals this season. He played 10:35 and had one shot on goal. The Hurricanes lost 6-2 to the Canadiens.

  2. at PIT

    Tuesday, December 30

    Ice time

    Eric Robinson played 18:06, about 6 minutes more than his average this season. He also had 8 shot attempts against an average of 3.0. The Hurricanes lost 5-1 to the Penguins.

  3. vs DET

    Saturday, December 27

    Volume

    Eric Robinson had 11 shot attempts, his most in a game since 2023-24. Five reached the net and one went in. He came in averaging 2.6 attempts a game. He has now scored in 3 straight. It finished 5-2 for the Hurricanes.

  4. at NSH

    Wednesday, December 17

    Volume

    Eric Robinson had 9 shot attempts. Five reached the net and none went in. He came in averaging 2.4 attempts a game. The Hurricanes beat the Predators 4-1.

Player card

Percentile among 378 forwards with enough games this season. 50 is the median.

Scoring

  • Ice time per game12:27
    19
  • Points per 602.89
    80
  • Goals per 600.96
    62
  • Individual xG per 600.78
    46
  • Shots per 607.7
    72

5-on-5 play

  • xG for per 60, on ice2.52
    53
  • xG against per 60, on ice2.15
    72
  • xGF%54.0%
    68

Physical

  • Hits per 6010.1
    83
  • Blocks per 601.4
    26
  • Penalty minutes per 600.0
    88

Skating and shooting

NHL EDGE puck and player tracking, 2026–27. Percentiles are the league's, against all skaters.

Skating

  • Top speed22.3 mph
    78
  • Bursts over 20 mph22
    86
  • Distance skated20 mi
    55

Shooting

  • Hardest shot76.9 mph
    30
  • Shots on goal16
    74
  • Shooting %12.5%
    51

Zone time

  • Offensive zone time45.4%
    81
  • Offensive zone time, even strength46.1%
    95

Who he plays with

His most-used linemates at 5-on-5 this season, with what happened while they were out together.

LinematesGamesTOIShot attemptsxGGoalsxG share
Mark Jankowski, Jesperi Kotkaniemi431:2230–161.8–0.73–372%
Nicolas Deslauriers, Jesperi Kotkaniemi319:5827–230.8–0.81–050%
Sebastian Aho, Andrei Svechnikov912:5517–80.9–0.70–055%
Jesperi Kotkaniemi, Felix Unger Sörum27:476–20.2–0.01–0100%
Logan Stankoven, Jackson Blake66:279–60.2–0.41–039%
Nicolas Deslauriers, Mark Jankowski24:363–70.0–0.40–01%
Jesperi Kotkaniemi, Logan Stankoven52:591–20.0–0.00–020%

Where he shoots from

His unblocked shots this season, attacking right. 2 goals from 22 attempts.

GoalShot or miss

Last 20 games

Columns are his individual expected goals, the quality of his own chances. Dots are goals he scored.

ixGGoal
0.000.200.400.60
05-2310-18

By season

SeasonGPGAPSOGixGTOI/GPHitsBlkxGF% 5v5
2026–2710246161.612:2721354.0
2025–2667126188410.411:26902355.6
2024–258214183211014.712:161232655.3
2023–24473710617.311:20942044.5

Last 20 games

DateTOIGASOGixGHitsBlkPIM
2026-10-1812:080120.24210
2026-10-1710:340110.03200
2026-10-1314:491040.32410
2026-10-1112:310010.19100
2026-10-1015:270100.00110
2026-10-0814:290050.47200
2026-10-068:031110.12100
2026-10-0311:440020.21100
2026-10-0211:440000.00200
2026-09-2913:000000.03500
2026-06-148:530010.00302
2026-06-119:130010.07200
2026-06-0910:180000.00100
2026-06-0618:440110.02210
2026-06-0410:230120.09200
2026-06-0211:020010.16300
2026-05-2912:211030.27000
2026-05-2710:430010.182010
2026-05-2512:520100.02300
2026-05-2310:121020.15100