GRIT & GF
Paul Cotter

Vancouver Canucks, Left wing

Paul Cotter

  • Finisher
  • Heavy
Points, 2026–27
7
4 G, 3 A in 10 GP
Individual xG
1.5
4 goals from it
Ice time per game
15:21
9 shots on goal
xGF% at 5v5
26.8
share of chances while he's on

Paul Cotter has 4 goals and 3 assists (7 points) in 10 games for the Vancouver Canucks in 2026–27, with 9 shots on goal and 15:21 of ice time a game. His Grit & GF rating for 2026–27 is 62.5 out of 100, provisional until he has 15 to 20 games.

10 games in. The methodology requires 15 to 20 games to be accurate, so this season's rating still leans on the league average for his position and will move.

GRIT & GF

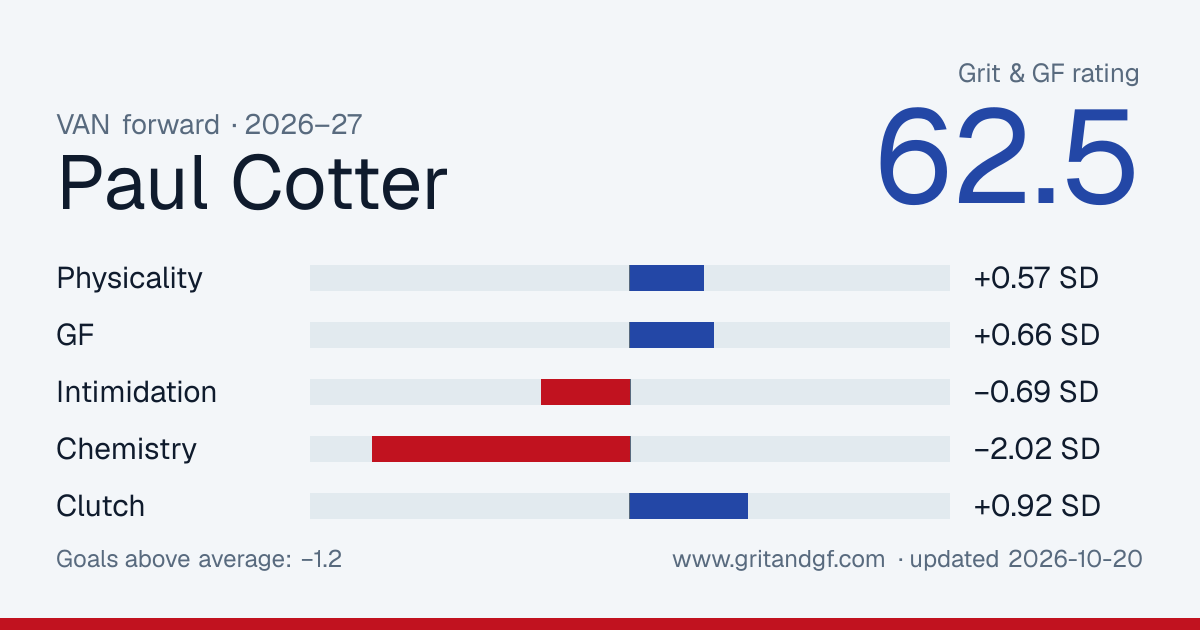
62.5050100
Rated above 46% of forwards
Goals above average
−1.2
Wins
−0.20
Physicality81thGF9thIntimidation34thChemistry2thClutch87th

Where the rating comes from

Weight × score in standard deviations. They sum to +0.13, which the normal curve turns into the rating.

Your weights

Under these weights he ranks above 46.5% of 402 rated players

The default weights are our call. Set your own; they get rescaled to add up to 100%.

Clutch

+0.92 SD · 87th percentile · weight 0%

His team's expected-goal differential with him on the ice in the third period or overtime of a one-goal game, against his own usual rate. Not counted in the rating since grit-0.5: it didn't repeat from season to season, so it was mostly luck.

  • Close-and-late liftxGD per 60Heavily shrunk: close-and-late minutes are scarce.0.0687th pct
  • Close-and-late ice timeminutesThe sample behind the clutch number.1957th pct

Percentiles are against 402 rated forwards in 2026-27, on 131 minutes of his 5-on-5 time. Hits, blocks and takeaways count toward the rating and are worth zero goals until a study shows otherwise. Model grit-0.5.
Embed or share this card

Free to use with a link back. The image updates as his rating does.

Paul Cotter's Grit & GF card
Download PNG

Game notes

Written the morning after from the night's stats, for games where he did something worth a sentence.

  1. at EDM

    Tuesday, September 29

    Overtime winner

    Paul Cotter won it in overtime. He scored twice. He has 2 goals this season. He played 11:51 and had three shots on goal. The Canucks beat the Oilers 6-5 in overtime.

  2. vs BOS

    Monday, March 16

    Overtime winner

    Paul Cotter scored the overtime winner. He scored twice. He has 8 goals this season. He played 9:18 and had two shots on goal. It finished 4-3 for the Devils in overtime.

  3. at PIT

    Thursday, February 26

    Drought over

    Paul Cotter scored for the first time in 23 games. He has 6 goals this season. He played 10:05 and had two shots on goal. The Devils lost 4-1 to the Penguins.

  4. vs CBJ

    Tuesday, February 3

    Physical

    Paul Cotter finished 8 checks, the most in the league that night. He has 10 points in 53 games this season. The Devils lost 3-0 to the Blue Jackets.

  5. vs ANA

    Saturday, December 13

    Streak

    Paul Cotter has scored in 3 straight games. His goal stood up as the winner. That was his fifth goal of the season. It finished 4-1 for the Devils.

  6. vs PIT

    Saturday, November 8

    Physical

    Paul Cotter threw 7 hits. He has 2 points in 15 games this season. He played 13:43 and had no shots on goal. It finished 2-1 for the Devils in a shootout.

  7. vs MIN

    Wednesday, October 22

    Drought over

    Paul Cotter scored for the first time in 16 games. That was his first goal of the season. He played 14:14 and had two shots on goal. It finished 4-1 for the Devils.

Player card

Percentile among 378 forwards with enough games this season. 50 is the median.

Scoring

  • Ice time per game15:21
    51
  • Points per 602.74
    77
  • Goals per 601.56
    85
  • Individual xG per 600.57
    20
  • Shots per 603.5
    10

5-on-5 play

  • xG for per 60, on ice1.24
    2
  • xG against per 60, on ice3.39
    8
  • xGF%26.8%
    1

Physical

  • Hits per 6012.9
    89
  • Blocks per 600.8
    10
  • Penalty minutes per 600.0
    88

Skating and shooting

NHL EDGE puck and player tracking, 2026–27. Percentiles are the league's, against all skaters.

Skating

  • Top speed22.0 mph
    69
  • Bursts over 20 mph27
    94
  • Distance skated25 mi
    86

Shooting

  • Hardest shot81.9 mph
    60
  • Shots on goal9
    43
  • Shooting %44.4%
    99

Zone time

  • Offensive zone time39.2%
    21
  • Offensive zone time, even strength38.4%
    15

Who he plays with

His most-used linemates at 5-on-5 this season, with what happened while they were out together.

LinematesGamesTOIShot attemptsxGGoalsxG share
Linus Karlsson, Marco Rossi525:3313–180.3–1.20–018%
Brock Boeser, Marco Rossi724:0227–110.8–0.70–153%
Brock Boeser, Liam Ohgren423:2816–300.7–1.82–128%
Brock Boeser, Filip Chytil219:326–260.2–1.90–011%
Brendan Gallagher, Arshdeep Bains313:308–170.2–0.90–115%
Brendan Gallagher, Marco Rossi32:140–40.0–0.10–00%
Brock Boeser, Elias Pettersson62:061–50.1–0.30–026%
Brock Boeser, Drew O'Connor62:041–00.0–0.00–0100%

Where he shoots from

His unblocked shots this season, attacking right. 4 goals from 15 attempts.

GoalShot or miss

Last 20 games

Columns are his individual expected goals, the quality of his own chances. Dots are goals he scored.

ixGGoal
0.000.250.500.75
03-2910-17

By season

SeasonGPGAPSOGixGTOI/GPHitsBlkxGF% 5v5
2026–271043791.515:2133226.8
2025–26799615618.810:411922340.4
2024–2579166229011.513:052453649.1
2023–24767182510011.912:442333551.5

Last 20 games

DateTOIGASOGixGHitsBlkPIM
2026-10-1715:330100.01200
2026-10-1515:390010.03400
2026-10-1315:300000.00500
2026-10-1116:090010.10110
2026-10-1015:110000.01400
2026-10-0814:360000.18400
2026-10-0418:461020.15110
2026-10-0314:050110.11500
2026-10-0116:121110.17500
2026-09-2911:512030.71200
2026-04-1412:310040.39110
2026-04-1210:230000.00100
2026-04-118:540000.06200
2026-04-0910:491010.20100
2026-04-0711:550000.08500
2026-04-057:140000.00100
2026-04-046:270000.00020
2026-04-026:580000.00310
2026-03-318:050010.23302
2026-03-297:360000.00000