GRIT & GF
Nils Hoglander

Nashville Predators, Left wing

Nils Hoglander

  • Finisher
  • Physical
Points, 2026–27
3
3 G, 0 A in 8 GP
Individual xG
1.1
3 goals from it
Ice time per game
11:00
10 shots on goal
xGF% at 5v5
51.9
share of chances while he's on

Nils Hoglander has 3 goals and 0 assists (3 points) in 8 games for the Nashville Predators in 2026–27, with 10 shots on goal and 11:00 of ice time a game. His Grit & GF rating for 2026–27 is 49.7 out of 100, provisional until he has 15 to 20 games.

8 games in. The methodology requires 15 to 20 games to be accurate, so this season's rating still leans on the league average for his position and will move.

GRIT & GF

49.7050100
Rated above 30% of forwards
Goals above average
+0.1
Wins
+0.02
Physicality12thGF48thIntimidation77thChemistry91thClutch8th

Where the rating comes from

Weight × score in standard deviations. They sum to −0.05, which the normal curve turns into the rating.

Your weights

Under these weights he ranks above 30.3% of 402 rated players

The default weights are our call. Set your own; they get rescaled to add up to 100%.

Chemistry

+0.59 SD · 91th percentile · weight 13% · +0.3 goals

How much his linemates' attack improves with him, measured teammate by teammate (with or without you), at 5-on-5.

  • Linemates' xGF liftper 60Teammates' expected goals per 60 with him minus without him, weighted by shared time.0.1891th pct
  • Shared minutes measuredminutesHow much evidence the chemistry number rests on.5674th pct

Percentiles are against 402 rated forwards in 2026-27, on 82 minutes of his 5-on-5 time. Hits, blocks and takeaways count toward the rating and are worth zero goals until a study shows otherwise. Model grit-0.5.
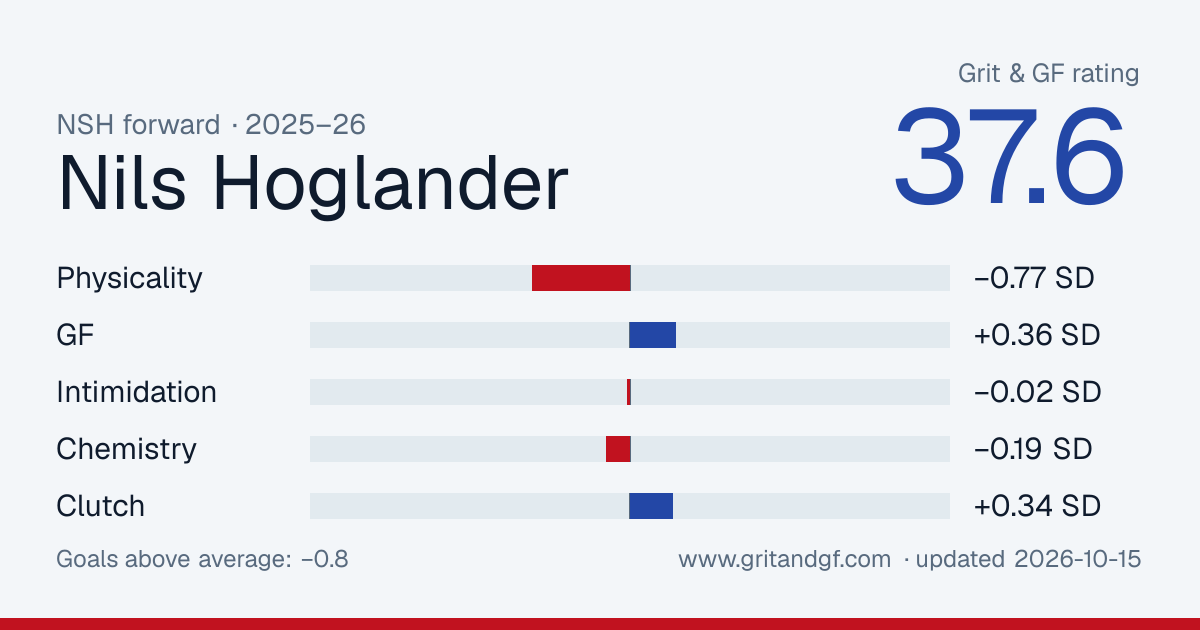
Embed or share this card

Free to use with a link back. The image updates as his rating does.

Nils Hoglander's Grit & GF card
Download PNG

Game notes

Written the morning after from the night's stats, for games where he did something worth a sentence.

  1. at TOR

    Tuesday, October 6

    Two goals

    Nils Hoglander scored twice. That was his third goal of the season. He played 10:38 and had two shots on goal. The Predators lost 5-4 to the Maple Leafs in overtime.

  2. vs CAR

    Wednesday, March 4

    Drought over

    Nils Hoglander scored for the first time in 24 games. He has 1 goal this season. He played 11:39 and had one shot on goal. The Canucks fell 6-4 to the Hurricanes.

Player card

Percentile among 378 forwards with enough games this season. 50 is the median.

Scoring

  • Ice time per game11:00
    10
  • Points per 602.04
    55
  • Goals per 602.04
    95
  • Individual xG per 600.75
    41
  • Shots per 606.8
    60

5-on-5 play

  • xG for per 60, on ice2.34
    42
  • xG against per 60, on ice2.16
    71
  • xGF%51.9%
    58

Physical

  • Hits per 607.5
    73
  • Blocks per 602.7
    62
  • Penalty minutes per 602.7
    26

Skating and shooting

NHL EDGE puck and player tracking, 2026–27. Percentiles are the league's, against all skaters.

Skating

  • Top speed21.0 mph
    23
  • Bursts over 20 mph5
    22
  • Distance skated15 mi
    30

Shooting

  • Hardest shot75.7 mph
    24
  • Shots on goal10
    49
  • Shooting %30.0%
    96

Zone time

  • Offensive zone time41.2%
    43
  • Offensive zone time, even strength41.1%
    52

Who he plays with

His most-used linemates at 5-on-5 this season, with what happened while they were out together.

LinematesGamesTOIShot attemptsxGGoalsxG share
Filip Forsberg, Matthew Wood847:0252–432.0–1.61–156%
Jack Drury, Adam Edstrom49:093–110.1–0.20–134%
Ross Colton, Matthew Wood83:302–10.2–0.00–092%
Ryan O'Reilly, Filip Forsberg72:471–80.0–0.30–00%
Steven Stamkos, Ryan O'Reilly52:371–20.1–0.00–072%
Alexander Kerfoot, Matthew Wood22:322–60.0–0.30–012%
Filip Forsberg, Jack Drury72:161–10.0–0.00–015%

Where he shoots from

His unblocked shots this season, attacking right. 3 goals from 12 attempts.

GoalShot or miss

Last 20 games

Columns are his individual expected goals, the quality of his own chances. Dots are goals he scored.

ixGGoal
0.000.200.400.60
03-1910-17

By season

SeasonGPGAPSOGixGTOI/GPHitsBlkxGF% 5v5
2026–278303101.111:0011451.9
2025–2638235354.011:3152943.6
2024–257281725839.412:08762953.0
2023–248024123612015.512:061002854.6

Last 20 games

DateTOIGASOGixGHitsBlkPIM
2026-10-179:210000.00210
2026-10-158:130020.08310
2026-10-1312:210010.01002
2026-10-1012:330020.11112
2026-10-0812:480010.07210
2026-10-0610:382020.58200
2026-10-0311:371020.21100
2026-10-0110:320000.05000
2026-04-1613:360000.00200
2026-04-1414:030120.16000
2026-04-1215:550020.12100
2026-04-1112:200010.06300
2026-04-0912:180010.14100
2026-04-0712:160000.05310
2026-04-016:570010.03100
2026-03-308:530010.02110
2026-03-287:421010.08000
2026-03-269:580000.01100
2026-03-2110:390010.07200
2026-03-1914:250000.09000