GRIT & GF
Brett Berard

New York Rangers, Left wing

Brett Berard

  • Stingy
  • Shot-eater
  • Physical
Points, 2025–26
0
0 G, 0 A in 13 GP
Individual xG
1.6
0 goals from it
Ice time per game
10:33
10 shots on goal
xGF% at 5v5
50.3
share of chances while he's on

Brett Berard has 0 goals and 0 assists (0 points) in 13 games for the New York Rangers in 2025–26, with 10 shots on goal and 10:33 of ice time a game. His Grit & GF rating for 2025–26 is 40.7 out of 100, provisional until he has 15 to 20 games.

13 games in. The methodology requires 15 to 20 games to be accurate, so this season's rating still leans on the league average for his position and will move.

GRIT & GF

2025-26

40.7050100
Rated above 23% of forwards
Goals above average
−0.1
Wins
−0.02
Physicality19thGF40thIntimidation61thChemistry49thClutch39th

Where the rating comes from

Weight × score in standard deviations. They sum to −0.13, which the normal curve turns into the rating.

Your weights

Under these weights he ranks above 22.8% of 531 rated players

The default weights are our call. Set your own; they get rescaled to add up to 100%.

Intimidation

+0.23 SD · 61th percentile · weight 11% · +0.2 goals

How the other team plays when he is on the ice, compared with when he is off it in the same games, at 5-on-5.

  • Chances suppressedxGA per 60, off minus onPositive means opponents create less with him on the ice.0.0870th pct
  • Opponents' hits suppressedper 60, off minus onPositive means opponents finish fewer checks with him out there.-1.6038th pct

Percentiles are against 531 rated forwards in 2025-26, on 137 minutes of his 5-on-5 time. Hits, blocks and takeaways count toward the rating and are worth zero goals until a study shows otherwise. Model grit-0.5.
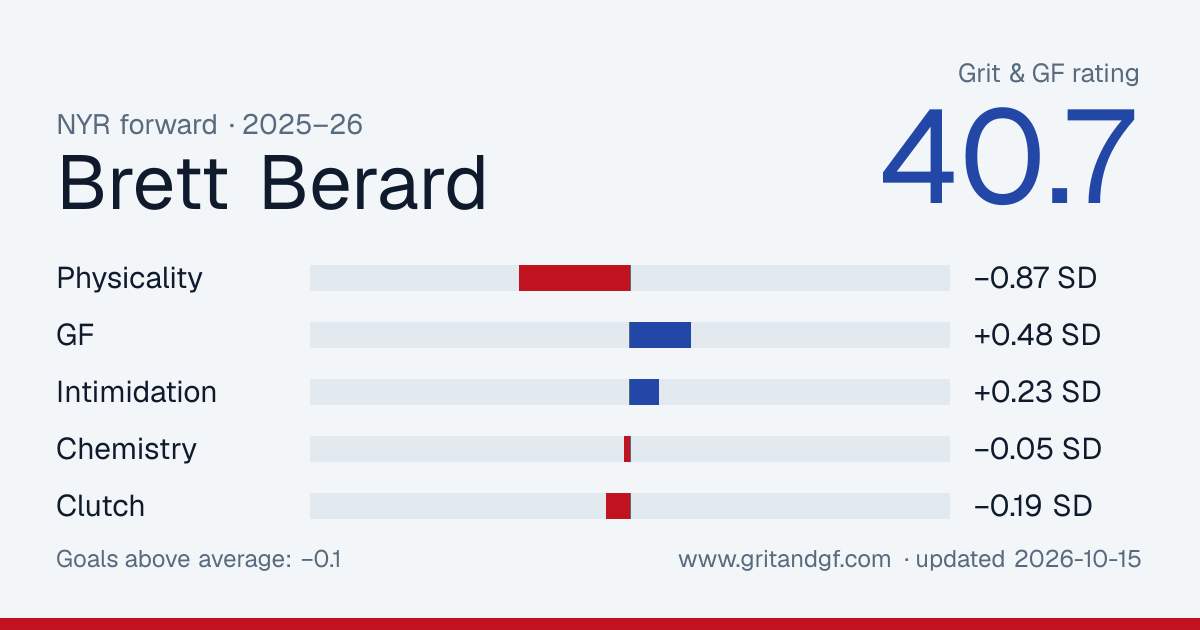
Embed or share this card

Free to use with a link back. The image updates as his rating does.

Brett Berard's Grit & GF card
Download PNG

Player card

Percentile among 476 forwards with enough games this season. He hasn't played enough yet to be ranked, so treat these as early. 50 is the median.

Scoring

  • Ice time per game10:33
    12
  • Points per 600.00
    0
  • Goals per 600.00
    0
  • Individual xG per 600.69
    30
  • Shots per 604.4
    13

5-on-5 play

  • xG for per 60, on ice2.10
    17
  • xG against per 60, on ice2.07
    92
  • xGF%50.3%
    58

Physical

  • Hits per 607.4
    73
  • Blocks per 603.9
    90
  • Penalty minutes per 602.6
    22

Who he plays with

His most-used linemates at 5-on-5 this season, with what happened while they were out together.

LinematesGamesTOIShot attemptsxGGoalsxG share
Will Cuylle, Noah Laba846:3039–441.6–1.41–254%
Jonny Brodzinski, Noah Laba733:2632–391.3–1.50–048%
Sam Carrick, Matt Rempe311:4510–120.5–0.30–059%
Conor Sheary, Noah Laba37:4712–40.3–0.10–069%
Sam Carrick, Taylor Raddysh94:544–110.3–0.40–040%
Sam Carrick, Jaroslav Chmelar34:491–80.0–0.10–00%
Taylor Raddysh, Noah Laba74:341–70.0–0.20–00%
Alexis Lafrenière, Noah Laba103:213–30.3–0.00–0100%

Where he shoots from

His unblocked shots this season, attacking right. 0 goals from 22 attempts.

GoalShot or miss

Last 20 games

Columns are his individual expected goals, the quality of his own chances. Dots are goals he scored.

ixGGoal
0.000.200.400.60
03-2801-29

By season

SeasonGPGAPSOGixGTOI/GPHitsBlkxGF% 5v5
2025–2613000101.610:3317950.3
2024–25356410594.210:43532143.1

Last 20 games

DateTOIGASOGixGHitsBlkPIM
2026-01-298:450000.06200
2026-01-027:270000.03000
2025-12-1510:240000.05110
2025-12-1311:210000.04000
2025-12-109:440000.00310
2025-12-0712:150010.24110
2025-12-0610:460000.00200
2025-12-0411:580010.16110
2025-12-0211:470010.03100
2025-11-2911:490000.00130
2025-11-2810:210020.27120
2025-11-2611:050030.46402
2025-11-249:210020.23004
2025-04-1212:460040.00110
2025-04-1012:372040.00110
2025-04-0911:490030.00410
2025-04-0510:000010.07200
2025-04-029:200010.01300
2025-03-2910:330030.18100
2025-03-288:490000.07100