GRIT & GF
Taylor Ward

Los Angeles Kings, Right wing

Taylor Ward

  • Stingy
  • Physical
Points, 2025–26
7
3 G, 4 A in 36 GP
Individual xG
4.5
3 goals from it
Ice time per game
9:28
38 shots on goal
xGF% at 5v5
51.2
share of chances while he's on

Taylor Ward has 3 goals and 4 assists (7 points) in 36 games for the Los Angeles Kings in 2025–26, with 38 shots on goal and 9:28 of ice time a game. His Grit & GF rating for 2025–26 is 34.8 out of 100.

GRIT & GF

2025-26

34.8050100
Rated above 15% of forwards
Goals above average
+0.2
Wins
+0.04
Physicality6thGF60thIntimidation57thChemistry45thClutch56th

Where the rating comes from

Weight × score in standard deviations. They sum to −0.26, which the normal curve turns into the rating.

Your weights

Under these weights he ranks above 15.1% of 531 rated players

The default weights are our call. Set your own; they get rescaled to add up to 100%.

GF

+0.69 SD · 60th percentile · weight 38% · −0.3 goals

Goals from the hard areas: attempts from inside 20 feet, rebounds and tips, and his own expected goals, all situations.

  • Inner-slot attemptsper 60Unblocked attempts from inside 20 feet.3.8048th pct
  • Rebounds and tipsper 60Second chances and redirects: the goals you get by standing where it hurts.3.3980th pct
  • Individual expected goalsper 60The quality of his own chances, all situations.0.8249th pct

Percentiles are against 531 rated forwards in 2025-26, on 323 minutes of his 5-on-5 time. Hits, blocks and takeaways count toward the rating and are worth zero goals until a study shows otherwise. Model grit-0.5.
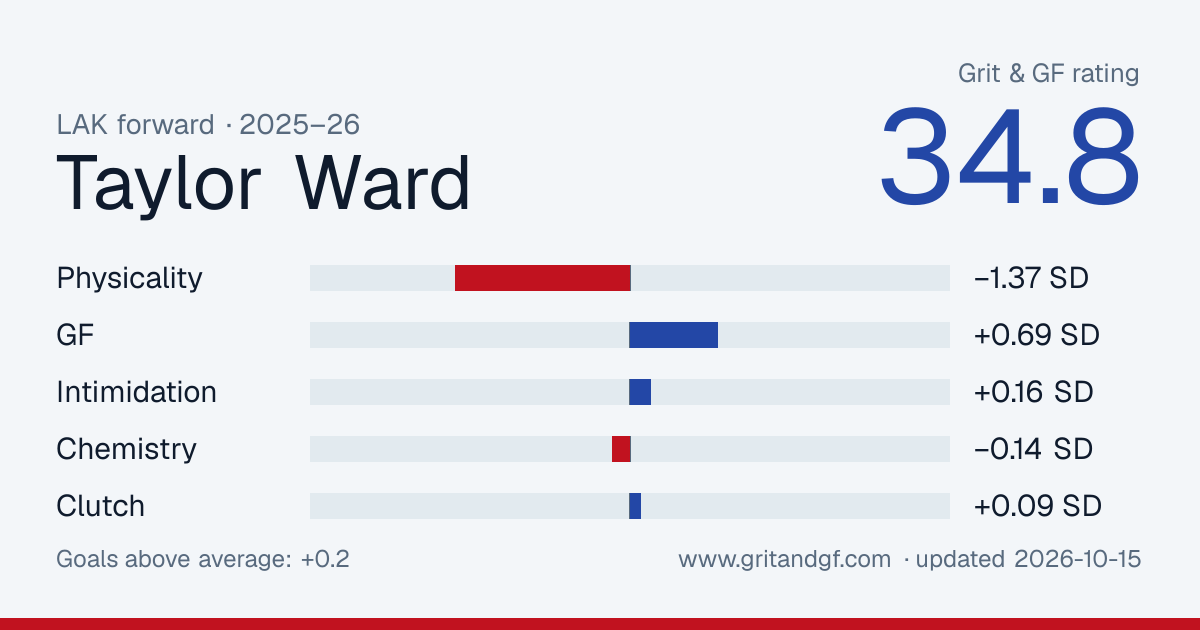
Embed or share this card

Free to use with a link back. The image updates as his rating does.

Taylor Ward's Grit & GF card
Download PNG

Player card

Percentile among 476 forwards with enough games this season. 50 is the median.

Scoring

  • Ice time per game9:28
    6
  • Points per 601.23
    22
  • Goals per 600.53
    26
  • Individual xG per 600.79
    45
  • Shots per 606.7
    61

5-on-5 play

  • xG for per 60, on ice2.20
    27
  • xG against per 60, on ice2.10
    91
  • xGF%51.2%
    64

Physical

  • Hits per 606.7
    70
  • Blocks per 601.8
    23
  • Penalty minutes per 601.2
    60

Who he plays with

His most-used linemates at 5-on-5 this season, with what happened while they were out together.

LinematesGamesTOIShot attemptsxGGoalsxG share
Jeff Malott, Samuel Helenius27147:23157–1606.4–4.47–559%
Andre Lee, Samuel Helenius727:3324–200.9–0.40–168%
Mathieu Joseph, Samuel Helenius626:0421–230.5–0.50–149%
Warren Foegele, Quinton Byfield616:2417–150.9–0.61–060%
Adrian Kempe, Alex Laferriere813:4620–130.4–0.61–041%
Trevor Moore, Quinton Byfield217:577–80.3–0.60–135%
Kevin Fiala, Quinton Byfield66:169–30.2–0.10–062%
Alex Turcotte, Jeff Malott46:154–70.0–0.70–03%

Where he shoots from

His unblocked shots this season, attacking right. 3 goals from 72 attempts.

GoalShot or miss

Last 20 games

Columns are his individual expected goals, the quality of his own chances. Dots are goals he scored.

ixGGoal
0.000.200.400.60
02-2804-26

By season

SeasonGPGAPSOGixGTOI/GPHitsBlkxGF% 5v5
2025–2636347384.59:28381051.2
2024–25110140.614:523068.0

Last 20 games

DateTOIGASOGixGHitsBlkPIM
2026-04-265:200010.10000
2026-04-166:100010.15110
2026-04-145:520010.04000
2026-04-138:200010.06100
2026-04-118:400010.08100
2026-04-098:100000.10100
2026-04-068:310010.10100
2026-04-045:170110.02100
2026-04-027:130000.14100
2026-04-015:360010.14105
2026-03-219:450000.04200
2026-03-198:120000.19000
2026-03-1611:280000.07200
2026-03-149:441020.05200
2026-03-137:040000.00002
2026-03-108:050000.01100
2026-03-078:040020.42210
2026-03-058:080130.18300
2026-03-0212:010000.00210
2026-02-2810:100050.17100