GRIT & GF
Nick Leddy

San Jose Sharks, Defence

Nick Leddy

  • Steady
  • Depth
Points, 2025–26
7
1 G, 6 A in 32 GP
Individual xG
1.1
1 goals from it
Ice time per game
17:52
16 shots on goal
xGF% at 5v5
45.0
share of chances while he's on

Nick Leddy has 1 goal and 6 assists (7 points) in 32 games for the San Jose Sharks in 2025–26, with 16 shots on goal and 17:52 of ice time a game. His Grit & GF rating for 2025–26 is 1.7 out of 100.

GRIT & GF

2025-26

1.7050100
Rated above 4% of defencemen
Goals above average
−3.2
Wins
−0.54
Physicality7thGF2thIntimidation31thChemistry36thClutch69th

Where the rating comes from

Weight × score in standard deviations. They sum to −1.21, which the normal curve turns into the rating.

Your weights

Under these weights he ranks above 4.3% of 281 rated players

The default weights are our call. Set your own; they get rescaled to add up to 100%.

Clutch

+0.38 SD · 69th percentile · weight 0%

His team's expected-goal differential with him on the ice in the third period or overtime of a one-goal game, against his own usual rate. Not counted in the rating since grit-0.5: it didn't repeat from season to season, so it was mostly luck.

  • Close-and-late liftxGD per 60Heavily shrunk: close-and-late minutes are scarce.0.0569th pct
  • Close-and-late ice timeminutesThe sample behind the clutch number.10329th pct

Percentiles are against 281 rated defencemen in 2025-26, on 518 minutes of his 5-on-5 time. Hits, blocks and takeaways count toward the rating and are worth zero goals until a study shows otherwise. Model grit-0.5.
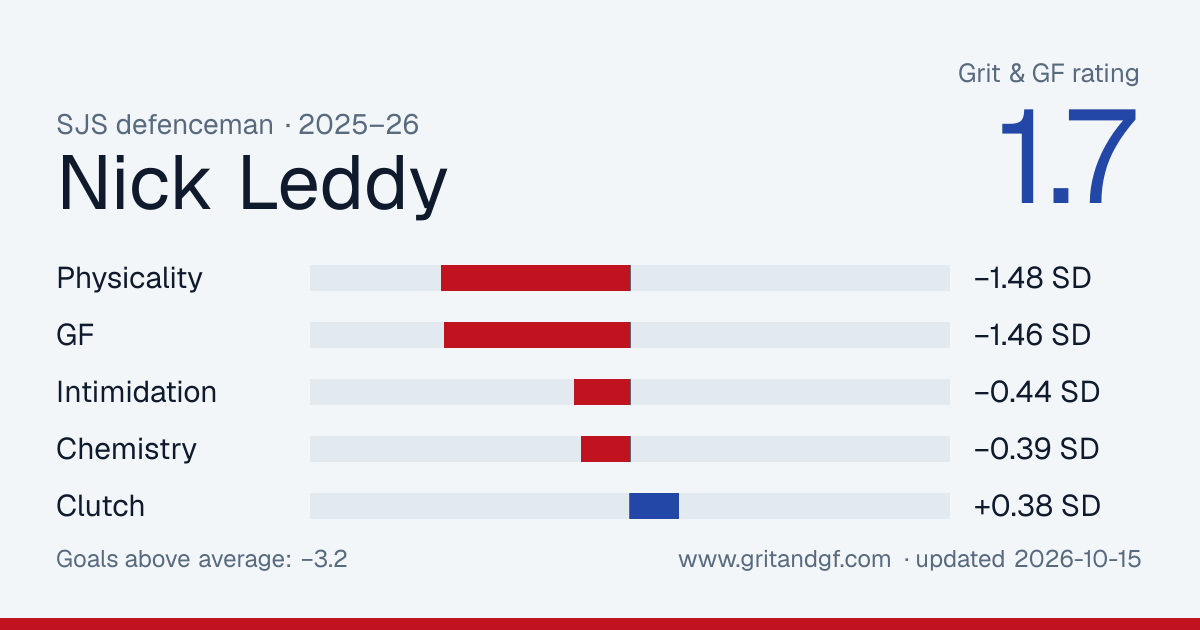
Embed or share this card

Free to use with a link back. The image updates as his rating does.

Nick Leddy's Grit & GF card
Download PNG

Game notes

Written the morning after from the night's stats, for games where he did something worth a sentence.

  1. vs NSH

    Saturday, April 4

    Drought over

    Nick Leddy scored for the first time in 35 games. He has 1 goal this season. He played 20:42 and had two shots on goal. The Sharks fell 6-3 to the Predators.

Player card

Percentile among 239 defencemen with enough games this season. 50 is the median.

Scoring

  • Ice time per game17:52
    42
  • Points per 600.73
    35
  • Goals per 600.10
    28
  • Individual xG per 600.11
    9
  • Shots per 601.7
    0

5-on-5 play

  • xG for per 60, on ice2.27
    21
  • xG against per 60, on ice2.77
    19
  • xGF%45.0%
    14

Physical

  • Hits per 600.7
    6
  • Blocks per 604.2
    51
  • Penalty minutes per 600.6
    88

Who he plays with

His most-used defence partners at 5-on-5 this season, with what happened while they were out together.

PartnerGamesTOIShot attemptsxGGoalsxG share
Sam Dickinson28276:09239–26311.0–12.412–1247%
Dmitry Orlov2854:4438–331.8–1.41–056%
Mario Ferraro3151:1642–602.7–2.41–454%
John Klingberg1433:2223–490.9–2.51–527%
Vincent Iorio728:1926–221.3–1.11–254%
Vincent Desharnais1727:2225–250.9–1.50–139%
Shakir Mukhamadullin1527:0718–260.7–1.30–333%
Timothy Liljegren1116:177–280.3–1.41–116%

Where he shoots from

His unblocked shots this season, attacking right. 1 goals from 29 attempts.

GoalShot or miss

Last 20 games

Columns are his individual expected goals, the quality of his own chances. Dots are goals he scored.

ixGGoal
0.000.100.20
12-0904-11

By season

SeasonGPGAPSOGixGTOI/GPHitsBlkxGF% 5v5
2025–2632167161.117:5274045.0
2024–2531235210.818:4052649.7
2023–248232528824.322:215112844.1

Last 20 games

DateTOIGASOGixGHitsBlkPIM
2026-04-1116:220010.07000
2026-04-0917:510000.00000
2026-04-0819:000010.00020
2026-04-0617:270010.06000
2026-04-0420:421120.17120
2026-04-0217:560000.05000
2026-04-0120:480000.00100
2026-03-3022:320100.03030
2026-03-2817:370000.02020
2026-03-2619:440000.02110
2026-03-2113:570000.00000
2026-03-1918:150020.09000
2026-03-1717:050030.04040
2026-01-1617:270100.00200
2026-01-1019:110000.00030
2026-01-0717:380000.12020
2026-01-0615:440000.00010
2025-12-2319:460000.00000
2025-12-1314:340000.00012
2025-12-0918:260020.14010