GRIT & GF
Chris Tanev

Toronto Maple Leafs, Defence

Chris Tanev

  • Shot-eater
  • Steady
Points, 2026–27
1
0 G, 1 A in 6 GP
Individual xG
0.0
0 goals from it
Ice time per game
16:51
1 shots on goal
xGF% at 5v5
45.5
share of chances while he's on

Chris Tanev has 0 goals and 1 assist (1 point) in 6 games for the Toronto Maple Leafs in 2026–27, with 1 shots on goal and 16:51 of ice time a game. His Grit & GF rating for 2026–27 is 11.8 out of 100, provisional until he has 15 to 20 games.

6 games in. The methodology requires 15 to 20 games to be accurate, so this season's rating still leans on the league average for his position and will move.

GRIT & GF

11.8050100
Rated above 31% of defencemen
Goals above average
−0.1
Wins
−0.02
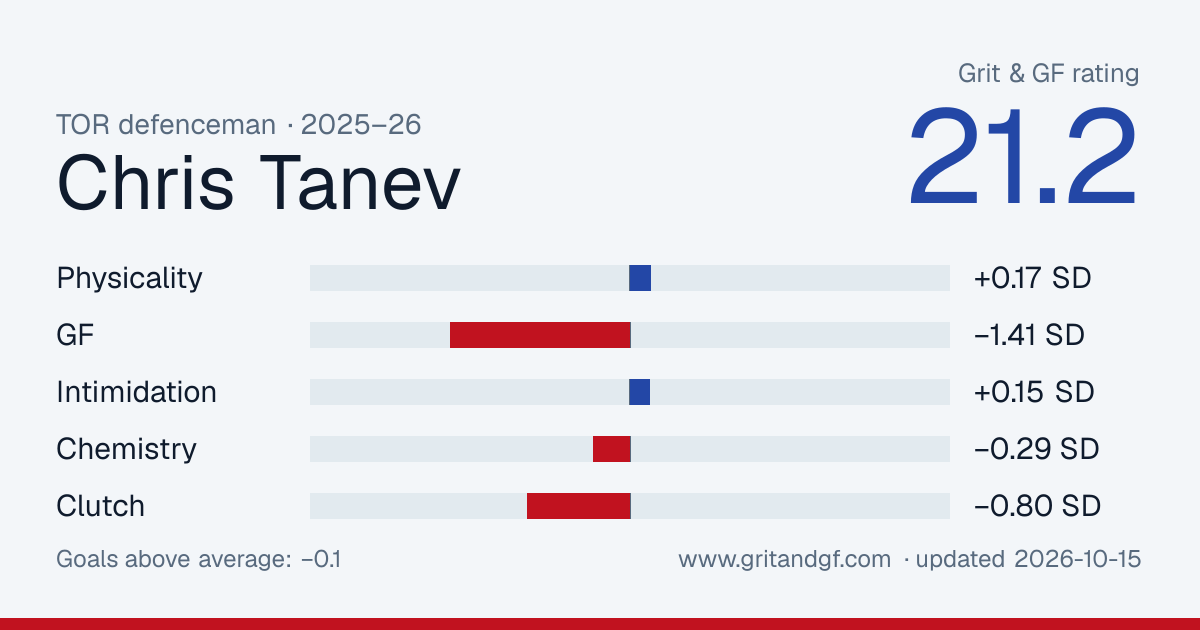
Physicality46thGF11thIntimidation16thChemistry21thClutch54th

Where the rating comes from

Weight × score in standard deviations. They sum to −0.67, which the normal curve turns into the rating.

Your weights

Under these weights he ranks above 31.4% of 223 rated players

The default weights are our call. Set your own; they get rescaled to add up to 100%.

Clutch

+0.06 SD · 54th percentile · weight 0%

His team's expected-goal differential with him on the ice in the third period or overtime of a one-goal game, against his own usual rate. Not counted in the rating since grit-0.5: it didn't repeat from season to season, so it was mostly luck.

  • Close-and-late liftxGD per 60Heavily shrunk: close-and-late minutes are scarce.0.0054th pct
  • Close-and-late ice timeminutesThe sample behind the clutch number.2044th pct

Percentiles are against 223 rated defencemen in 2026-27, on 78 minutes of his 5-on-5 time. Hits, blocks and takeaways count toward the rating and are worth zero goals until a study shows otherwise. Model grit-0.5.
Embed or share this card

Free to use with a link back. The image updates as his rating does.

Chris Tanev's Grit & GF card
Download PNG

Player card

Percentile among 194 defencemen with enough games this season. 50 is the median.

Scoring

  • Ice time per game16:50
    26
  • Points per 600.59
    32
  • Goals per 600.00
    30
  • Individual xG per 600.02
    2
  • Shots per 600.6
    1

5-on-5 play

  • xG for per 60, on ice2.30
    38
  • xG against per 60, on ice2.75
    32
  • xGF%45.5%
    28

Physical

  • Hits per 600.6
    11
  • Blocks per 608.3
    97
  • Penalty minutes per 600.0
    93

Skating and shooting

NHL EDGE puck and player tracking, 2026–27. Percentiles are the league's, against all skaters.

Skating

  • Top speed20.9 mph
    49
  • Bursts over 20 mph3
    41
  • Distance skated14 mi
    31

Shooting

  • Hardest shot68.7 mph
    3
  • Shots on goal1
    11
  • Shooting %0.0%
    43

Zone time

  • Offensive zone time36.0%
    4
  • Offensive zone time, even strength39.8%
    21

Who he plays with

His most-used defence partners at 5-on-5 this season, with what happened while they were out together.

PartnerGamesTOIShot attemptsxGGoalsxG share
Jake McCabe665:3041–592.0–2.92–141%
Oliver Ekman-Larsson64:404–90.4–0.30–060%
Morgan Rielly64:384–20.4–0.11–180%

Where he shoots from

His unblocked shots this season, attacking right. 0 goals from 2 attempts.

GoalShot or miss

Last 20 games

Columns are his individual expected goals, the quality of his own chances. Dots are goals he scored.

ixGGoal
0.000.050.10
05-1410-10

By season

SeasonGPGAPSOGixGTOI/GPHitsBlkxGF% 5v5
2026–27601110.016:5111445.5
2025–261102280.217:5821550.7
2024–257531518431.619:452019154.9
2023–247521719561.619:424520754.6

Last 20 games

DateTOIGASOGixGHitsBlkPIM
2026-10-103:290000.01000
2026-10-0822:100100.00040
2026-10-0618:380000.00130
2026-10-0317:280000.00010
2026-09-3020:390000.00030
2026-09-2918:390010.02030
2025-12-2820:100010.03040
2025-12-2721:270000.00010
2025-12-2317:230010.02020
2025-11-0114:500100.01000
2025-10-215:570000.00010
2025-10-1820:320030.04010
2025-10-1617:520010.01000
2025-10-1419:420010.04010
2025-10-1319:000000.00110
2025-10-1117:460100.00010
2025-10-0823:030010.03130
2025-05-1817:550000.00020
2025-05-1619:320000.05060
2025-05-1417:340000.00120