GRIT & GF
John Leonard

Detroit Red Wings, Left wing

John Leonard

  • Shot-eater
  • Disciplined
Points, 2025–26
4
2 G, 2 A in 11 GP
Individual xG
1.5
2 goals from it
Ice time per game
11:30
11 shots on goal
xGF% at 5v5
47.8
share of chances while he's on

John Leonard has 2 goals and 2 assists (4 points) in 11 games for the Detroit Red Wings in 2025–26, with 11 shots on goal and 11:30 of ice time a game. His Grit & GF rating for 2025–26 is 71.4 out of 100, provisional until he has 15 to 20 games.

11 games in. The methodology requires 15 to 20 games to be accurate, so this season's rating still leans on the league average for his position and will move.

GRIT & GF

2025-26

71.4050100
Rated above 61% of forwards
Goals above average
+0.3
Wins
+0.05
Physicality55thGF67thIntimidation49thChemistry69thClutch37th

Where the rating comes from

Weight × score in standard deviations. They sum to +0.33, which the normal curve turns into the rating.

Your weights

Under these weights he ranks above 60.8% of 531 rated players

The default weights are our call. Set your own; they get rescaled to add up to 100%.

Chemistry

+0.44 SD · 69th percentile · weight 13% · +0.3 goals

How much his linemates' attack improves with him, measured teammate by teammate (with or without you), at 5-on-5.

  • Linemates' xGF liftper 60Teammates' expected goals per 60 with him minus without him, weighted by shared time.0.1469th pct
  • Shared minutes measuredminutesHow much evidence the chemistry number rests on.1726th pct

Percentiles are against 531 rated forwards in 2025-26, on 112 minutes of his 5-on-5 time. Hits, blocks and takeaways count toward the rating and are worth zero goals until a study shows otherwise. Model grit-0.5.
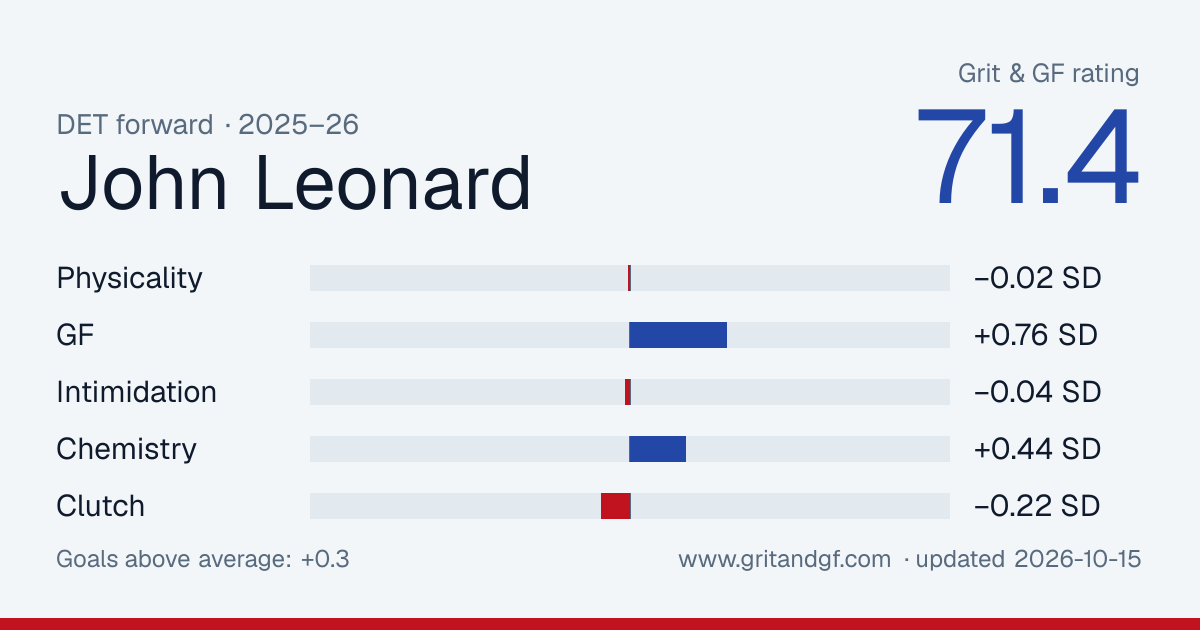
Embed or share this card

Free to use with a link back. The image updates as his rating does.

John Leonard's Grit & GF card
Download PNG

Player card

Percentile among 476 forwards with enough games this season. He hasn't played enough yet to be ranked, so treat these as early. 50 is the median.

Scoring

  • Ice time per game11:30
    19
  • Points per 601.90
    58
  • Goals per 600.95
    68
  • Individual xG per 600.73
    35
  • Shots per 605.2
    27

5-on-5 play

  • xG for per 60, on ice2.32
    37
  • xG against per 60, on ice2.52
    50
  • xGF%47.8%
    36

Physical

  • Hits per 605.7
    63
  • Blocks per 604.7
    96
  • Penalty minutes per 600.0
    100

Who he plays with

His most-used linemates at 5-on-5 this season, with what happened while they were out together.

LinematesGamesTOIShot attemptsxGGoalsxG share
Andrew Copp, Alex DeBrincat755:2462–563.0–2.22–458%
Mason Appleton, Michael Rasmussen213:045–190.1–0.60–013%
James van Riemsdyk, Marco Kasper29:493–130.2–0.40–039%
Marco Kasper, Nate Danielson36:1713–60.2–0.20–054%
James van Riemsdyk, Emmitt Finnie13:333–40.1–0.20–034%
Elmer Soderblom, Nate Danielson23:201–70.0–0.30–05%
Dylan Larkin, Marco Kasper22:132–20.1–0.20–040%
Dylan Larkin, Emmitt Finnie82:123–10.0–0.00–069%

Where he shoots from

His unblocked shots this season, attacking right. 2 goals from 24 attempts.

GoalShot or miss

Last 17 games

Columns are his individual expected goals, the quality of his own chances. Dots are goals he scored.

ixGGoal
0.000.100.200.30
03-1203-16

By season

SeasonGPGAPSOGixGTOI/GPHitsBlkxGF% 5v5
2025–2611224111.511:30121047.8
2023–24610150.36:521544.8

Last 20 games

DateTOIGASOGixGHitsBlkPIM
2026-03-169:100000.22220
2026-03-149:100020.08210
2026-01-0811:170000.00100
2026-01-0511:030010.19010
2025-12-287:310010.09010
2025-12-2712:400100.19300
2025-12-2313:330020.02110
2025-12-2114:001020.18110
2025-12-2012:571010.24010
2025-12-1712:080100.01110
2025-12-1613:020020.30110
2024-03-244:570000.00010
2024-03-226:540000.06010
2024-03-2010:191010.10110
2024-03-167:080010.03010
2024-03-146:320020.05010
2024-03-125:220010.02000