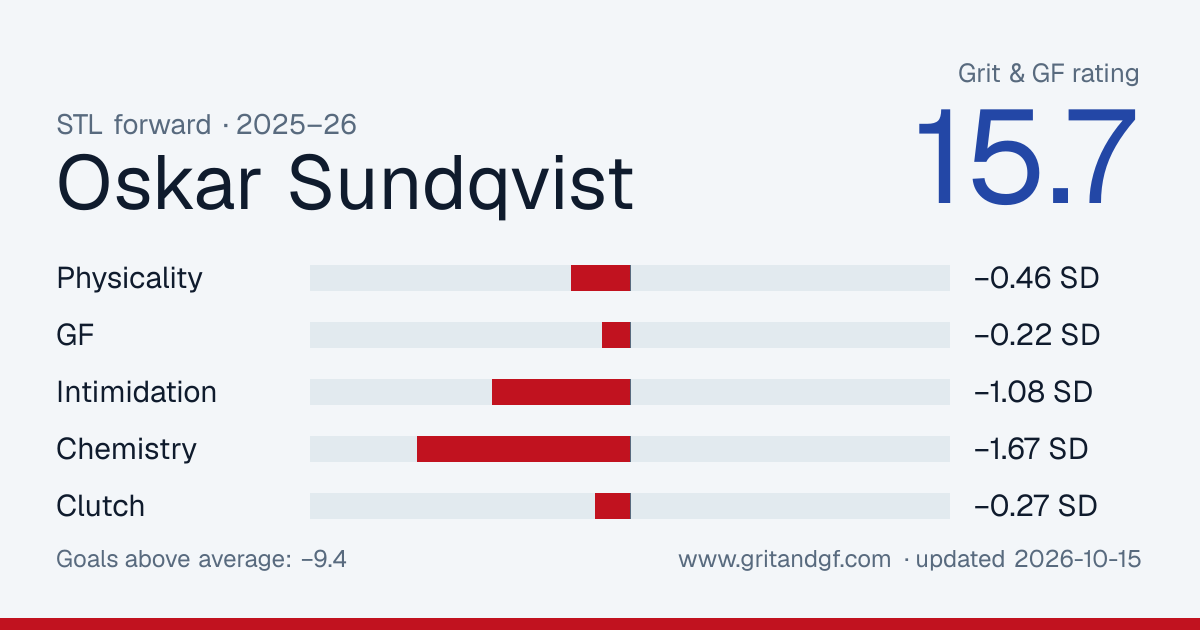
GRIT & GF
2025-26
- Goals above average
- −9.4
- Wins
- −1.57
Where the rating comes from
Weight × score in standard deviations. They sum to −0.59, which the normal curve turns into the rating.
Your weights
Under these weights he ranks above 2.6% of 531 rated players
The default weights are our call. Set your own; they get rescaled to add up to 100%.
Physicality
−0.46 SD · 38th percentile · weight 38% · −0.7 goals
What he does with his body: hits, blocks and takeaways (scaled toward per-game totals by his ice time), penalties drawn, and penalties taken against him.
- Hitsper 60All situations, pulled toward average when the sample is small.6.162th pct
- Blocked shotsper 60All situations.2.449th pct
- Takeawaysper 60As recorded by the arena scorer, which varies by building.1.0467th pct
- Penalties drawnper 60How often he gets under someone's skin enough to put his team on the power play.0.6633th pct
- Penalties takenper 60Counts against him, at half the weight of penalties drawn.1.0918th pct
- Ice time× position averagePer-game ice time against his position's average. Physical rates are scaled by this to the power 0.75.0.8740th pct
Percentiles are against 531 rated forwards in 2025-26, on 528 minutes of his 5-on-5 time. Hits, blocks and takeaways count toward the rating and are worth zero goals until a study shows otherwise. Model grit-0.5.