GRIT & GF
Jack Finley

St Louis Blues, Centre

Jack Finley

  • Physical
  • Stingy
  • Edgy
Points, 2025–26
5
2 G, 3 A in 44 GP
Individual xG
3.9
2 goals from it
Ice time per game
9:43
26 shots on goal
xGF% at 5v5
47.3
share of chances while he's on

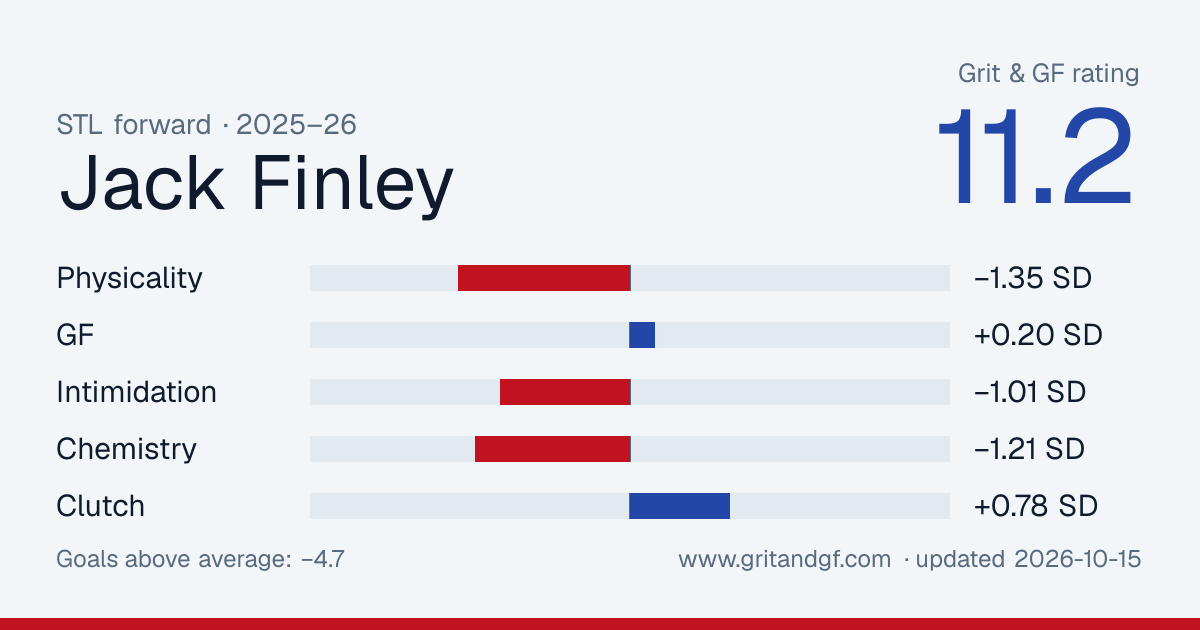
Jack Finley has 2 goals and 3 assists (5 points) in 44 games for the St Louis Blues in 2025–26, with 26 shots on goal and 9:43 of ice time a game. His Grit & GF rating for 2025–26 is 11.2 out of 100.

GRIT & GF

2025-26

11.2050100
Rated above 1% of forwards
Goals above average
−4.7
Wins
−0.79
Physicality7thGF15thIntimidation16thChemistry11thClutch82th

Where the rating comes from

Weight × score in standard deviations. They sum to −0.71, which the normal curve turns into the rating.

Your weights

Under these weights he ranks above 1.3% of 531 rated players

The default weights are our call. Set your own; they get rescaled to add up to 100%.

Clutch

+0.78 SD · 82th percentile · weight 0%

His team's expected-goal differential with him on the ice in the third period or overtime of a one-goal game, against his own usual rate. Not counted in the rating since grit-0.5: it didn't repeat from season to season, so it was mostly luck.

  • Close-and-late liftxGD per 60Heavily shrunk: close-and-late minutes are scarce.0.1082th pct
  • Close-and-late ice timeminutesThe sample behind the clutch number.6722th pct

Percentiles are against 531 rated forwards in 2025-26, on 382 minutes of his 5-on-5 time. Hits, blocks and takeaways count toward the rating and are worth zero goals until a study shows otherwise. Model grit-0.5.
Embed or share this card

Free to use with a link back. The image updates as his rating does.

Jack Finley's Grit & GF card
Download PNG

Player card

Percentile among 476 forwards with enough games this season. 50 is the median.

Scoring

  • Ice time per game9:43
    7
  • Points per 600.70
    4
  • Goals per 600.28
    9
  • Individual xG per 600.55
    11
  • Shots per 603.7
    4

5-on-5 play

  • xG for per 60, on ice1.94
    9
  • xG against per 60, on ice2.16
    88
  • xGF%47.3%
    32

Physical

  • Hits per 6010.5
    84
  • Blocks per 601.8
    27
  • Penalty minutes per 605.3
    5

Who he plays with

His most-used linemates at 5-on-5 this season, with what happened while they were out together.

LinematesGamesTOIShot attemptsxGGoalsxG share
Nathan Walker, Alexey Toropchenko753:0046–471.2–2.70–330%
Alexey Toropchenko, Pius Suter1245:3236–361.5–1.80–045%
Oskar Sundqvist, Alexey Toropchenko644:0631–260.8–1.20–041%
Oliver Bjorkstrand, Nick Paul832:2215–220.5–1.00–034%
Scott Sabourin, Curtis Douglas531:2836–282.3–1.12–168%
Gage Goncalves, Dominic James517:2712–190.5–0.51–047%
Pavel Buchnevich, Alexey Toropchenko613:279–180.1–0.40–017%
Oliver Bjorkstrand, Dominic James411:135–110.1–0.70–017%

Where he shoots from

His unblocked shots this season, attacking right. 2 goals from 37 attempts.

GoalShot or miss

Last 20 games

Columns are his individual expected goals, the quality of his own chances. Dots are goals he scored.

ixGGoal
0.000.501.00
03-0104-16

By season

SeasonGPGAPSOGixGTOI/GPHitsBlkxGF% 5v5
2025–2644235263.99:43751347.3
2024–25100010.18:251041.5

Last 20 games

DateTOIGASOGixGHitsBlkPIM
2026-04-1614:130030.11200
2026-04-1312:350000.00000
2026-04-0910:090000.00400
2026-04-077:440000.00100
2026-04-0512:060000.00012
2026-04-017:550000.00305
2026-03-3010:430000.00200
2026-03-2810:380000.00414
2026-03-2611:050010.02220
2026-03-2413:170010.00300
2026-03-2111:030020.19200
2026-03-1810:280010.12210
2026-03-1511:030000.00000
2026-03-1311:030000.03000
2026-03-1211:330100.17102
2026-03-1010:510010.06300
2026-03-0810:520020.98000
2026-03-0611:100020.15200
2026-03-0412:030000.11200
2026-03-019:380010.02102