GRIT & GF
Steven Lorentz

Toronto Maple Leafs, Centre

Steven Lorentz

  • Shot-eater
  • Heavy
Points, 2025–26
18
7 G, 11 A in 71 GP
Individual xG
8.4
7 goals from it
Ice time per game
11:52
70 shots on goal
xGF% at 5v5
45.4
share of chances while he's on

Steven Lorentz has 7 goals and 11 assists (18 points) in 71 games for the Toronto Maple Leafs in 2025–26, with 70 shots on goal and 11:52 of ice time a game. His Grit & GF rating for 2025–26 is 70.7 out of 100.

GRIT & GF

2025-26

70.7050100
Rated above 60% of forwards
Goals above average
−2.4
Wins
−0.39
Physicality80thGF13thIntimidation79thChemistry17thClutch68th

Where the rating comes from

Weight × score in standard deviations. They sum to +0.33, which the normal curve turns into the rating.

Your weights

Under these weights he ranks above 60.1% of 531 rated players

The default weights are our call. Set your own; they get rescaled to add up to 100%.

Physicality

+0.78 SD · 80th percentile · weight 38% · +0.3 goals

What he does with his body: hits, blocks and takeaways (scaled toward per-game totals by his ice time), penalties drawn, and penalties taken against him.

  • Hitsper 60All situations, pulled toward average when the sample is small.10.286th pct
  • Blocked shotsper 60All situations.3.588th pct
  • Takeawaysper 60As recorded by the arena scorer, which varies by building.1.1779th pct
  • Penalties drawnper 60How often he gets under someone's skin enough to put his team on the power play.0.439th pct
  • Penalties takenper 60Counts against him, at half the weight of penalties drawn.0.3692th pct
  • Ice time× position averagePer-game ice time against his position's average. Physical rates are scaled by this to the power 0.75.0.8028th pct

Percentiles are against 531 rated forwards in 2025-26, on 675 minutes of his 5-on-5 time. Hits, blocks and takeaways count toward the rating and are worth zero goals until a study shows otherwise. Model grit-0.5.
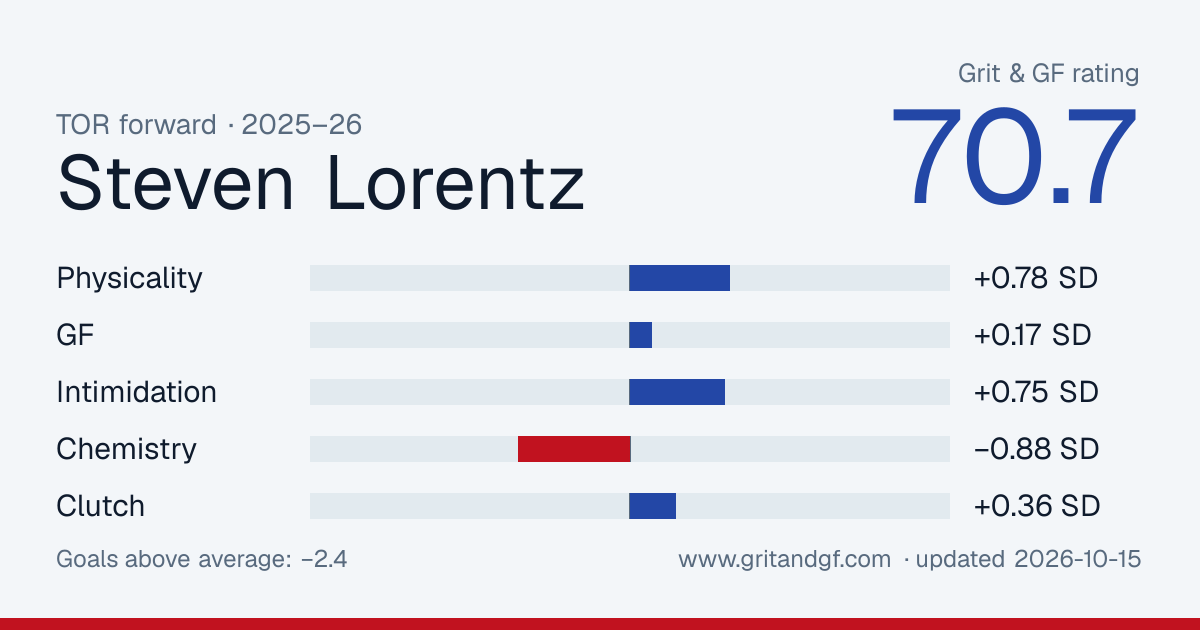
Embed or share this card

Free to use with a link back. The image updates as his rating does.

Steven Lorentz's Grit & GF card
Download PNG

Game notes

Written the morning after from the night's stats, for games where he did something worth a sentence.

  1. at OTT

    Wednesday, April 15

    Physical

    Steven Lorentz threw 8 hits, the most in the league that night. He has 18 points in 71 games this season. The Maple Leafs lost 3-1 to the Senators.

  2. vs DAL

    Monday, April 13

    Physical

    Steven Lorentz finished 8 checks. He has 18 points in 70 games this season. He played 13:19 and had two shots on goal. The Maple Leafs lost 6-5 to the Stars.

  3. vs NYI

    Tuesday, March 17

    Drought over

    Steven Lorentz scored for the first time in 29 games. That was his fifth goal of the season. The Maple Leafs lost 3-1 to the Islanders.

  4. at BOS

    Tuesday, November 11

    Drought over

    Steven Lorentz scored for the first time in 24 games. He has 1 goal this season. He played 11:49 and had two shots on goal. The Maple Leafs lost 5-3 to the Bruins.

Player card

Percentile among 476 forwards with enough games this season. 50 is the median.

Scoring

  • Ice time per game11:52
    23
  • Points per 601.28
    25
  • Goals per 600.50
    24
  • Individual xG per 600.60
    16
  • Shots per 605.0
    23

5-on-5 play

  • xG for per 60, on ice1.95
    9
  • xG against per 60, on ice2.34
    73
  • xGF%45.4%
    19

Physical

  • Hits per 6011.0
    85
  • Blocks per 603.6
    87
  • Penalty minutes per 601.1
    66

Who he plays with

His most-used linemates at 5-on-5 this season, with what happened while they were out together.

LinematesGamesTOIShot attemptsxGGoalsxG share
Calle Jarnkrok, Scott Laughton22150:00113–1574.5–5.83–444%
Calle Jarnkrok, Jacob Quillan1361:4348–761.7–3.01–337%
Scott Laughton, Nick Robertson3143:2626–591.1–1.83–037%
Scott Laughton, Easton Cowan1638:4834–391.5–1.61–148%
Scott Laughton, Dakota Joshua1232:1922–291.2–0.91–158%
Scott Laughton, Bobby McMann2523:0322–310.6–1.21–134%
Scott Laughton, Max Domi2622:5420–230.7–1.30–336%
Nick Robertson, Luke Haymes217:5718–190.6–0.71–246%

Where he shoots from

His unblocked shots this season, attacking right. 7 goals from 104 attempts.

GoalShot or miss

Last 20 games

Columns are his individual expected goals, the quality of his own chances. Dots are goals he scored.

ixGGoal
0.000.200.40
02-2604-15

By season

SeasonGPGAPSOGixGTOI/GPHitsBlkxGF% 5v5
2025–267171118708.411:521545145.4
2024–258081119768.010:331996351.2
2023–2438123303.68:48701651.2

Last 20 games

DateTOIGASOGixGHitsBlkPIM
2026-04-1516:220010.14800
2026-04-1313:190120.12802
2026-04-1114:480000.12220
2026-04-0915:151020.18012
2026-04-0812:050020.35100
2026-04-0410:331020.25300
2026-04-0214:030020.25220
2026-03-2811:300000.13200
2026-03-2511:470010.14220
2026-03-2411:270020.37110
2026-03-2110:300000.00300
2026-03-2012:180010.12320
2026-03-1712:031030.19120
2026-03-1510:540000.00200
2026-03-1010:380000.00010
2026-03-0711:500000.12210
2026-03-0511:070010.18100
2026-03-048:210010.13200
2026-03-0211:050010.22200
2026-02-2613:450000.15110