GRIT & GF
Philip Broberg

St Louis Blues, Defence

Philip Broberg

  • Steady
  • Depth
Points, 2026–27
4
1 G, 3 A in 8 GP
Individual xG
1.0
1 goals from it
Ice time per game
22:54
13 shots on goal
xGF% at 5v5
49.9
share of chances while he's on

Philip Broberg has 1 goal and 3 assists (4 points) in 8 games for the St Louis Blues in 2026–27, with 13 shots on goal and 22:54 of ice time a game. His Grit & GF rating for 2026–27 is 41.8 out of 100, provisional until he has 15 to 20 games.

8 games in. The methodology requires 15 to 20 games to be accurate, so this season's rating still leans on the league average for his position and will move.

GRIT & GF

41.8050100
Rated above 79% of defencemen
Goals above average
+0.2
Wins
+0.03
Physicality84thGF80thIntimidation20thChemistry51thClutch18th

Where the rating comes from

Weight × score in standard deviations. They sum to −0.16, which the normal curve turns into the rating.

Your weights

Under these weights he ranks above 78.9% of 223 rated players

The default weights are our call. Set your own; they get rescaled to add up to 100%.

Physicality

+0.71 SD · 84th percentile · weight 38% · +0.3 goals

What he does with his body: hits, blocks and takeaways (scaled toward per-game totals by his ice time), penalties drawn, and penalties taken against him.

  • Hitsper 60All situations, pulled toward average when the sample is small.1.913th pct
  • Blocked shotsper 60All situations.3.313th pct
  • Takeawaysper 60As recorded by the arena scorer, which varies by building.1.2891th pct
  • Penalties drawnper 60How often he gets under someone's skin enough to put his team on the power play.0.9695th pct
  • Penalties takenper 60Counts against him, at half the weight of penalties drawn.0.5583th pct
  • Ice time× position averagePer-game ice time against his position's average. Physical rates are scaled by this to the power 0.75.1.1187th pct

Percentiles are against 223 rated defencemen in 2026-27, on 142 minutes of his 5-on-5 time. Hits, blocks and takeaways count toward the rating and are worth zero goals until a study shows otherwise. Model grit-0.5.
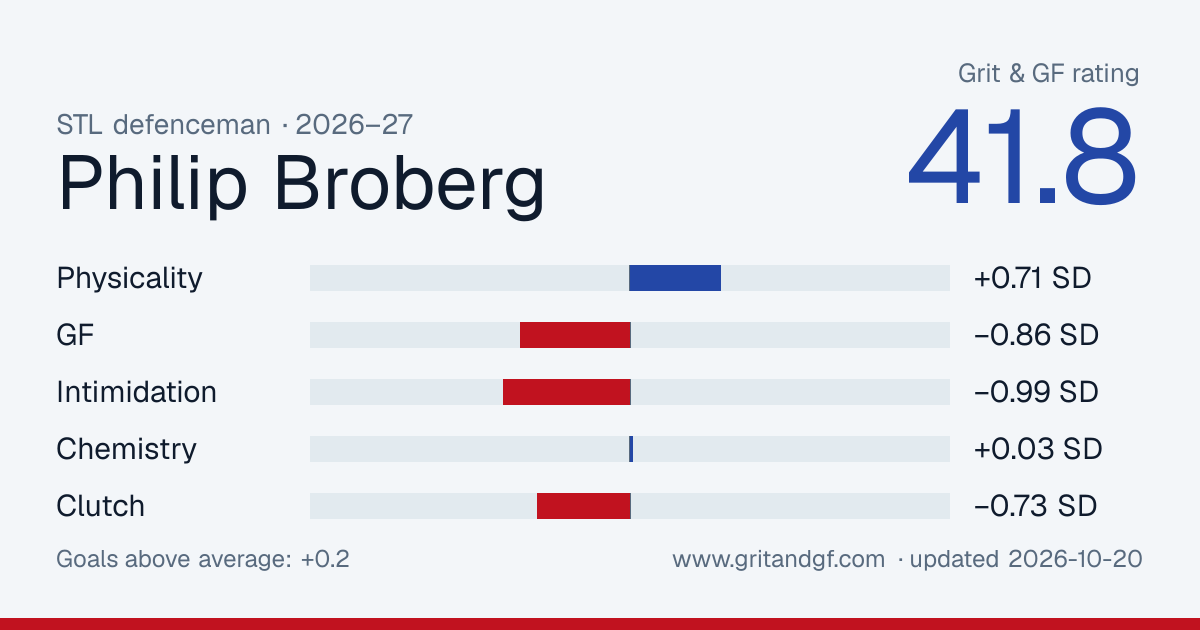
Embed or share this card

Free to use with a link back. The image updates as his rating does.

Philip Broberg's Grit & GF card
Download PNG

Game notes

Written the morning after from the night's stats, for games where he did something worth a sentence.

  1. at NSH

    Saturday, October 17

    Drought over

    Philip Broberg scored for the first time in 16 games. He also had 7 shot attempts against an average of 3.0. The Blues lost 5-2 to the Predators.

  2. at ANA

    Friday, April 3

    Streak

    Philip Broberg has a point in 7 straight games. He has 31 points in 74 games this season. He played 23:04 and had one shot on goal. The Blues beat the Ducks 6-2.

  3. at LAK

    Wednesday, April 1

    Streak

    Philip Broberg has a point in 6 straight games. He has 29 points in 73 games this season. The Blues lost 2-1 to the Kings in overtime.

  4. at SJS

    Monday, March 30

    Streak

    Philip Broberg has a point in 5 straight games. He has 6 goals this season. He played 23:49 and had one shot on goal. The Blues lost 5-4 to the Sharks.

  5. at SJS

    Friday, March 6

    Ice time

    Philip Broberg played 32:51, about 10 minutes more than his average this season. He has 21 points in 61 games this season. The Blues beat the Sharks 3-2 in overtime.

  6. vs WPG

    Wednesday, December 17

    Shot blocker

    Philip Broberg blocked 6 shots. He has 12 points in 35 games this season. He played 25:02 and had no shots on goal. The Blues beat the Jets 1-0.

  7. at CBJ

    Saturday, November 1

    Volume

    Philip Broberg had 10 shot attempts. Four got through to the goalie, and none went in. He came in averaging 3.1 attempts a game. The Blues lost 3-2 to the Blue Jackets.

Player card

Percentile among 194 defencemen with enough games this season. 50 is the median.

Scoring

  • Ice time per game22:54
    86
  • Points per 601.31
    73
  • Goals per 600.33
    68
  • Individual xG per 600.31
    75
  • Shots per 604.3
    64

5-on-5 play

  • xG for per 60, on ice2.49
    50
  • xG against per 60, on ice2.50
    53
  • xGF%49.9%
    47

Physical

  • Hits per 601.0
    19
  • Blocks per 602.6
    14
  • Penalty minutes per 600.7
    79

Skating and shooting

NHL EDGE puck and player tracking, 2026–27. Percentiles are the league's, against all skaters.

Skating

  • Top speed24.3 mph
    100
  • Bursts over 20 mph13
    93
  • Distance skated26 mi
    81

Shooting

  • Hardest shot81.3 mph
    31
  • Shots on goal13
    83
  • Shooting %7.7%
    63

Zone time

  • Offensive zone time41.8%
    54
  • Offensive zone time, even strength43.5%
    71

Who he plays with

His most-used defence partners at 5-on-5 this season, with what happened while they were out together.

PartnerGamesTOIShot attemptsxGGoalsxG share
Adam Jiricek869:0970–543.6–2.55–259%
Colton Parayko845:0535–401.4–2.61–435%
Justin Barron58:1810–80.2–0.41–139%
Cam Fowler87:155–60.1–0.30–121%
Brandon Carlo86:3210–40.5–0.10–080%
Theo Lindstein43:196–10.1–0.00–079%

Where he shoots from

His unblocked shots this season, attacking right. 1 goals from 16 attempts.

GoalShot or miss

Last 20 games

Columns are his individual expected goals, the quality of his own chances. Dots are goals he scored.

ixGGoal
0.000.200.40
03-2610-17

By season

SeasonGPGAPSOGixGTOI/GPHitsBlkxGF% 5v5
2026–278134131.022:543849.9
2025–268162834988.523:22359952.2
2024–256882129975.820:304310452.6
2023–241202260.211:3741051.3

Last 20 games

DateTOIGASOGixGHitsBlkPIM
2026-10-1725:101040.35010
2026-10-1522:260000.01010
2026-10-1322:060010.10032
2026-10-1023:190110.05000
2026-10-0824:250020.08100
2026-10-0622:250110.13110
2026-10-0320:160030.02110
2026-10-0223:080110.23010
2026-04-1622:110120.03012
2026-04-1421:380130.15000
2026-04-1321:520010.07010
2026-04-1120:520000.00020
2026-04-0922:320110.04000
2026-04-0725:120030.11130
2026-04-0522:190000.00010
2026-04-0323:040210.11100
2026-04-0123:160100.13010
2026-03-3023:491010.27002
2026-03-2821:511010.10000
2026-03-2623:300100.00212