GRIT & GF
Nick Paul

Toronto Maple Leafs, Left wing

Nick Paul

  • Physical
  • Shot-eater
Points, 2026–27
5
2 G, 3 A in 10 GP
Individual xG
2.7
2 goals from it
Ice time per game
16:05
9 shots on goal
xGF% at 5v5
48.2
share of chances while he's on

Nick Paul has 2 goals and 3 assists (5 points) in 10 games for the Toronto Maple Leafs in 2026–27, with 9 shots on goal and 16:05 of ice time a game. His Grit & GF rating for 2026–27 is 92.4 out of 100, provisional until he has 15 to 20 games.

10 games in. The methodology requires 15 to 20 games to be accurate, so this season's rating still leans on the league average for his position and will move.

GRIT & GF

92.4050100
Rated above 89% of forwards
Goals above average
+0.8
Wins
+0.13
Physicality86thGF50thIntimidation17thChemistry98thClutch22th

Where the rating comes from

Weight × score in standard deviations. They sum to +0.82, which the normal curve turns into the rating.

Your weights

Under these weights he ranks above 88.6% of 402 rated players

The default weights are our call. Set your own; they get rescaled to add up to 100%.

Chemistry

+1.75 SD · 98th percentile · weight 13% · +0.8 goals

How much his linemates' attack improves with him, measured teammate by teammate (with or without you), at 5-on-5.

  • Linemates' xGF liftper 60Teammates' expected goals per 60 with him minus without him, weighted by shared time.0.4098th pct
  • Shared minutes measuredminutesHow much evidence the chemistry number rests on.11086th pct

Percentiles are against 402 rated forwards in 2026-27, on 126 minutes of his 5-on-5 time. Hits, blocks and takeaways count toward the rating and are worth zero goals until a study shows otherwise. Model grit-0.5.
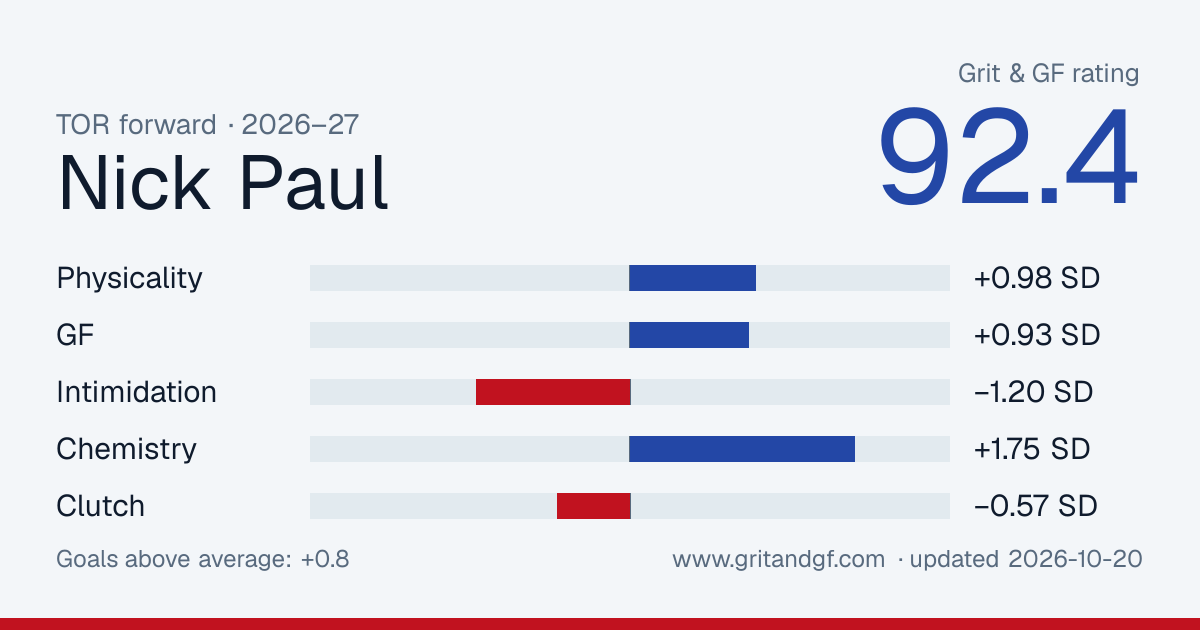
Embed or share this card

Free to use with a link back. The image updates as his rating does.

Nick Paul's Grit & GF card
Download PNG

Game notes

Written the morning after from the night's stats, for games where he did something worth a sentence.

  1. vs MTL

    Sunday, April 19

    Physical

    Nick Paul finished 7 checks. He has 15 points in 52 games this season. He played 13:47 and had one shot on goal. The Lightning lost 4-3 to the Canadiens in overtime.

  2. vs NYR

    Wednesday, April 15

    Ice time

    Nick Paul played 21:47, about 8 minutes more than his average this season. He also had 7 shot attempts against an average of 2.7. The Lightning fell 4-2 to the Rangers.

  3. vs PIT

    Thursday, December 4

    Streak

    Nick Paul has a point in 5 straight games. He has 6 points in 8 games this season. The Lightning fell 4-3 to the Penguins.

Player card

Percentile among 378 forwards with enough games this season. 50 is the median.

Scoring

  • Ice time per game16:05
    59
  • Points per 601.87
    46
  • Goals per 600.75
    50
  • Individual xG per 601.02
    67
  • Shots per 603.4
    8

5-on-5 play

  • xG for per 60, on ice2.75
    66
  • xG against per 60, on ice2.96
    22
  • xGF%48.2%
    42

Physical

  • Hits per 607.5
    73
  • Blocks per 603.7
    82
  • Penalty minutes per 602.2
    29

Skating and shooting

NHL EDGE puck and player tracking, 2026–27. Percentiles are the league's, against all skaters.

Skating

  • Top speed22.1 mph
    69
  • Bursts over 20 mph13
    63
  • Distance skated26 mi
    82

Shooting

  • Hardest shot74.7 mph
    20
  • Shots on goal9
    41
  • Shooting %22.2%
    88

Zone time

  • Offensive zone time39.3%
    22
  • Offensive zone time, even strength40.3%
    39

Who he plays with

His most-used linemates at 5-on-5 this season, with what happened while they were out together.

LinematesGamesTOIShot attemptsxGGoalsxG share
Colton Sissons, Easton Cowan928:5833–152.1–0.52–179%
Colton Sissons, Gavin McKenna720:3213–250.7–0.71–048%
William Nylander, Kirill Marchenko611:1313–100.9–0.70–055%
John Tavares, Kirill Marchenko19:154–110.1–0.71–114%
Kirill Marchenko, Easton Cowan58:438–90.6–0.30–164%
William Nylander, Easton Cowan84:343–60.3–0.31–145%
Colton Sissons, Brandon Duhaime53:327–30.0–0.30–08%
Jack Roslovic, Easton Cowan73:101–30.0–0.10–128%

Where he shoots from

His unblocked shots this season, attacking right. 2 goals from 19 attempts.

GoalShot or miss

Last 20 games

Columns are his individual expected goals, the quality of his own chances. Dots are goals he scored.

ixGGoal
0.000.501.001.50
04-0910-19

By season

SeasonGPGAPSOGixGTOI/GPHitsBlkxGF% 5v5
2026–271023592.716:05201048.2
2025–26517815688.613:41752748.3
2024–257622194114117.116:27664248.2
2023–248224224615321.117:161046149.9

Last 20 games

DateTOIGASOGixGHitsBlkPIM
2026-10-1918:521011.03222
2026-10-1714:360000.20400
2026-10-1517:130010.08100
2026-10-1314:010000.00220
2026-10-1017:150200.16210
2026-10-0817:051020.36130
2026-10-0613:270020.26300
2026-10-0317:030020.41200
2026-09-3015:430110.23102
2026-09-2915:320000.00222
2026-05-0312:380020.43410
2026-05-0112:250000.15420
2026-04-267:330000.01202
2026-04-247:580010.15310
2026-04-2113:320030.19112
2026-04-1913:470010.04710
2026-04-1521:470030.74000
2026-04-1315:000020.13000
2026-04-1113:580010.15210
2026-04-097:380000.003112