GRIT & GF
Noah Ostlund

Buffalo Sabres, Centre

Noah Ostlund

  • Two-way
  • Play-driver
Points, 2026–27
6
2 G, 4 A in 9 GP
Individual xG
3.0
2 goals from it
Ice time per game
18:53
20 shots on goal
xGF% at 5v5
60.1
share of chances while he's on

Noah Ostlund has 2 goals and 4 assists (6 points) in 9 games for the Buffalo Sabres in 2026–27, with 20 shots on goal and 18:53 of ice time a game. His Grit & GF rating for 2026–27 is 51.3 out of 100, provisional until he has 15 to 20 games.

9 games in. The methodology requires 15 to 20 games to be accurate, so this season's rating still leans on the league average for his position and will move.

GRIT & GF

51.3050100
Rated above 33% of forwards
Goals above average
+0.6
Wins
+0.09
Physicality7thGF48thIntimidation97thChemistry89thClutch4th

Where the rating comes from

Weight × score in standard deviations. They sum to −0.02, which the normal curve turns into the rating.

Your weights

Under these weights he ranks above 32.6% of 402 rated players

The default weights are our call. Set your own; they get rescaled to add up to 100%.

Intimidation

+1.58 SD · 97th percentile · weight 11% · +0.2 goals

How the other team plays when he is on the ice, compared with when he is off it in the same games, at 5-on-5.

  • Chances suppressedxGA per 60, off minus onPositive means opponents create less with him on the ice.0.0985th pct
  • Opponents' hits suppressedper 60, off minus onPositive means opponents finish fewer checks with him out there.3.2598th pct

Percentiles are against 402 rated forwards in 2026-27, on 127 minutes of his 5-on-5 time. Hits, blocks and takeaways count toward the rating and are worth zero goals until a study shows otherwise. Model grit-0.5.
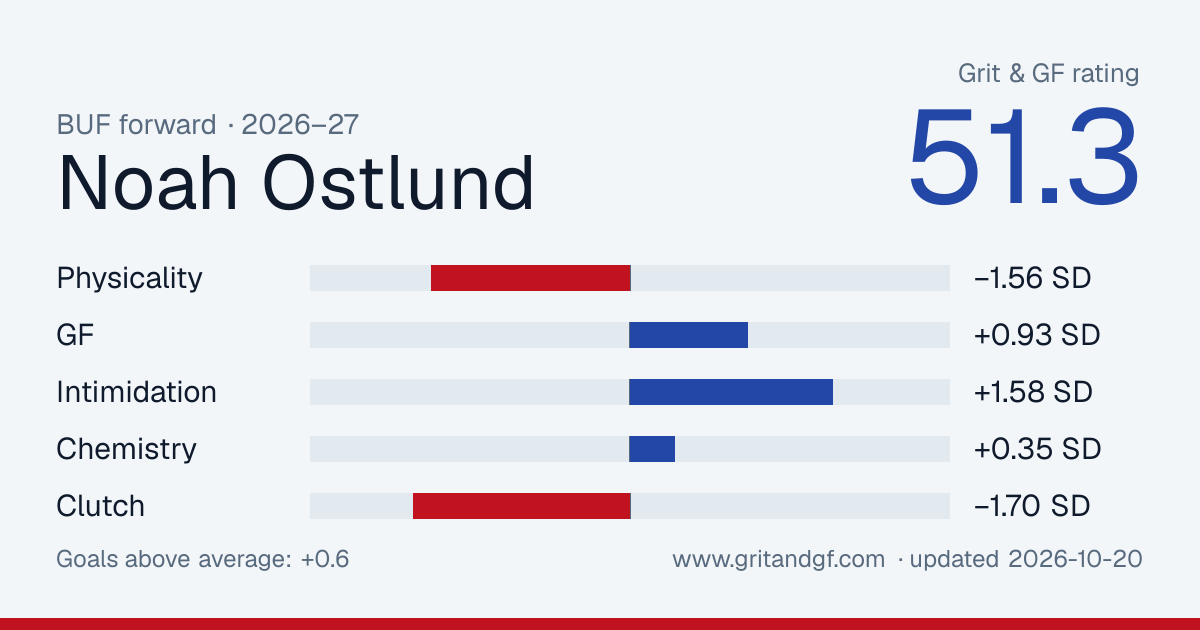
Embed or share this card

Free to use with a link back. The image updates as his rating does.

Noah Ostlund's Grit & GF card
Download PNG

Game notes

Written the morning after from the night's stats, for games where he did something worth a sentence.

  1. vs UTA

    Saturday, October 10

    Volume

    Noah Ostlund had 12 shot attempts, his most in a game since 2023-24. Five reached the net and none went in. He came in averaging 4.2 attempts a game. The Sabres lost 4-1 to the Mammoth.

  2. at NSH

    Tuesday, January 20

    Two goals

    Noah Ostlund had two goals. He has 9 goals this season. He played 16:58 and had three shots on goal. The Sabres beat the Predators 5-3.

  3. vs MTL

    Thursday, January 15

    Volume

    Noah Ostlund had 8 shot attempts, his most in a game since 2023-24. Three got through to the goalie, and none went in. His average this season was 1.9. It finished 5-3 for the Sabres.

  4. vs EDM

    Monday, November 17

    Two goals

    Noah Ostlund had two goals. That was his third goal of the season. He played 10:42 and had three shots on goal. It finished 5-1 for the Sabres.

  5. at COL

    Thursday, November 13

    Ice time

    Noah Ostlund played 18:18, about 6 minutes more than his average this season. He has 3 points in 9 games this season. The Sabres fell 6-3 to the Avalanche.

Player card

Percentile among 378 forwards with enough games this season. 50 is the median.

Scoring

  • Ice time per game18:53
    83
  • Points per 602.12
    59
  • Goals per 600.71
    48
  • Individual xG per 601.07
    71
  • Shots per 607.1
    64

5-on-5 play

  • xG for per 60, on ice3.14
    84
  • xG against per 60, on ice2.08
    75
  • xGF%60.1%
    87

Physical

  • Hits per 600.4
    3
  • Blocks per 601.4
    24
  • Penalty minutes per 601.4
    52

Skating and shooting

NHL EDGE puck and player tracking, 2026–27. Percentiles are the league's, against all skaters.

Skating

  • Top speed20.7 mph
    11
  • Bursts over 20 mph10
    50
  • Distance skated28 mi
    94

Shooting

  • Hardest shot82.0 mph
    60
  • Shots on goal20
    86
  • Shooting %10.0%
    35

Zone time

  • Offensive zone time47.2%
    92
  • Offensive zone time, even strength45.2%
    92

Who he plays with

His most-used linemates at 5-on-5 this season, with what happened while they were out together.

LinematesGamesTOIShot attemptsxGGoalsxG share
Jack Quinn, Zach Benson995:37111–545.6–2.86–166%
Josh Doan, Zach Benson710:3412–110.4–0.50–144%
Peyton Krebs, Josh Doan72:404–30.2–0.00–084%
Peyton Krebs, Jack Quinn82:371–60.0–0.10–018%
Tage Thompson, Zach Benson42:183–10.2–0.00–093%

Where he shoots from

His unblocked shots this season, attacking right. 2 goals from 31 attempts.

GoalShot or miss

Last 20 games

Columns are his individual expected goals, the quality of his own chances. Dots are goals he scored.

ixGGoal
0.000.501.00
03-1010-17

By season

SeasonGPGAPSOGixGTOI/GPHitsBlkxGF% 5v5
2026–279246203.018:531460.1
2025–2660111627607.013:5853552.0
2024–25800040.310:331345.2

Last 20 games

DateTOIGASOGixGHitsBlkPIM
2026-10-1719:440010.10014
2026-10-1521:390210.06000
2026-10-1319:400010.40100
2026-10-1217:541030.22000
2026-10-1019:080050.99000
2026-10-0817:050020.15000
2026-10-0620:391020.46020
2026-10-0317:230020.27010
2026-10-0116:420230.35000
2026-04-282:550020.12002
2026-04-2617:190000.00000
2026-04-2314:181120.89010
2026-03-2514:310010.17000
2026-03-2214:420100.05000
2026-03-2113:010020.21010
2026-03-1916:061020.36010
2026-03-1715:460000.06002
2026-03-1415:460100.00012
2026-03-1216:490000.02010
2026-03-1015:290030.35000